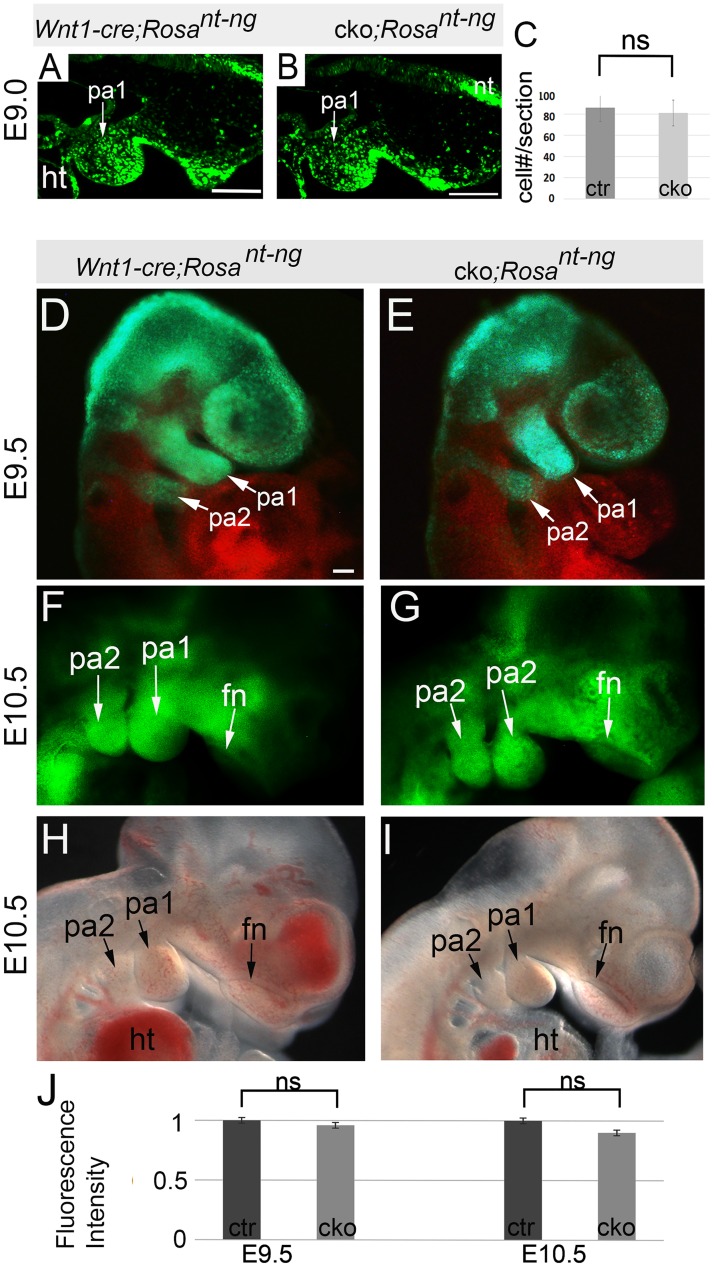
Fig 4. Initial NCC migration and PA morphogenesis.
(A, B) Sagittal sections of E9.0 embryos (15-somite stage). (C) Quantification of the number of NCCs at E9.0 stage. (D, E) E9.5 embryos observed by a fluorescent microscope. Green fluorescence (GFP) labels NCCs; red fluorescence (tdTomato) labels non-NCCs. (F, G) E10.5 embryos observed by a fluorescent microscope. (H, I) Dark field observation of E10.5 embryos. (J) Quantification of GFP fluorescence intensity of E9.5 and E10.5 mice. fn: frontonasal prominence; ht: heart: ns: non-significant; pa: pharyngeal arch. Scale bars: 100 μm.

