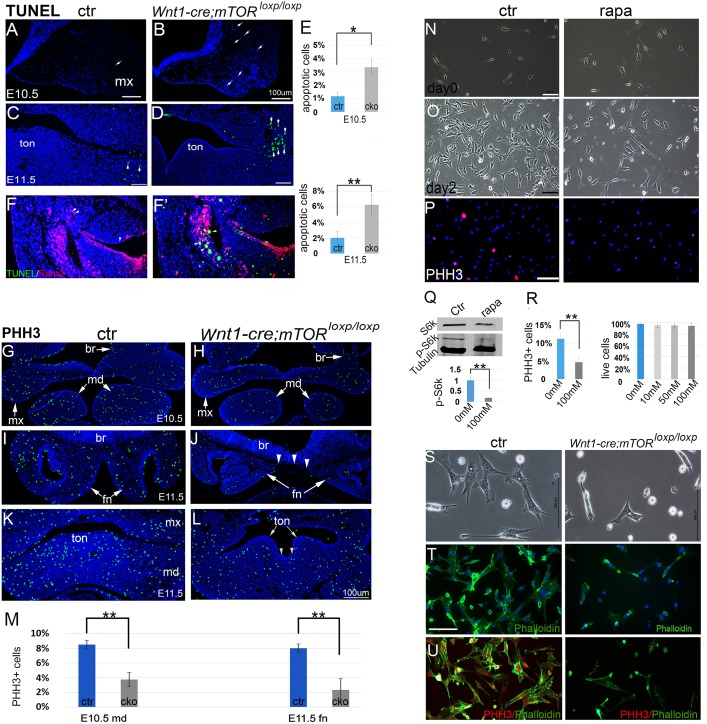
Fig 5. Apoptosis and proliferation assays.
(A-D) Apoptosis at E10.5 and E11.5. (E) Quantification of apoptotic cells. (F, F’) Dual staining of TUNEL and Runx2 shows that apoptotic cells are predominantly NCC descendants. (G, H) Immunofluorescence for PHH3 in E10.5 facial primordia. (I, J) Immunofluorescence for PHH3 in the FN at E11.5. (K, L) Immunofluorescence for PHH3 in the mandibular arch at E11.5. Arrowheads indicate groove in the tongue. (M) Quantification of PHH3+ cells. (N, O) O9 NCCs cultured with and without rapamycin (100nM). (P) PHH3 staining of O9 cells. (Q)Western blot for mTORC1 downstream target p-S6K1/S6K1 upon rapamycin treatment. (R) Percentage of PHH3+ cells and cell live/death assay. (S) Phase contrast images of cultured PA cells. (T) Phalloidin and Dapi staining of PA cells. (U) PHH3 and Phalloidin double staining of PA cells. br: brain; ctr: control; fn: frontonasal prominence; md: mandibular prominence; mx: maxillary prominence; rapa: rapamycin; ton: tongue. Scale bars in (A-D): 100 μm.; scale bars in (L-U): 200 μm; scale bar in (L) applies to (G-K).

