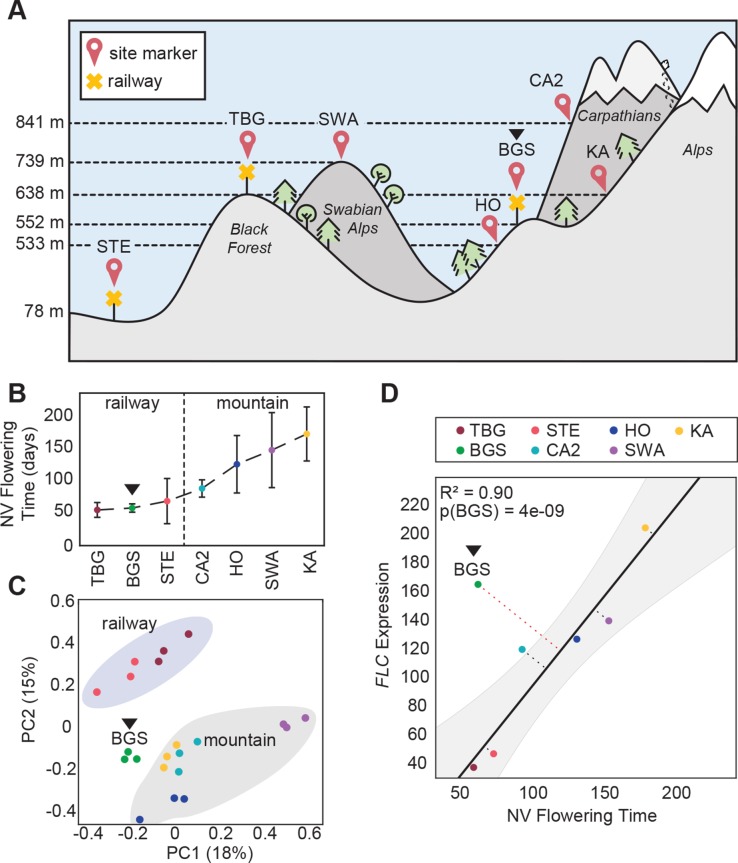
Fig 1. BGS, a transcriptomic outlier among railway populations.
(A) Schematic representation of the habitats and altitudes where the railway populations (yellow cross markers): TBG, STE, and BGS (black triangle across all subfigures) and mountain populations: SWA, KA, HO, CA2 were sampled (GPS coordinates in S1 Table). (B) Vernalization response of populations reproduced from Baduel et al. as the difference between non-vernalized and vernalized flowering time. All railway populations present almost identical null vernalization responses. (C) First two principal components (PC1 and 2 with percentage of variance explained) of Principal Component Analysis (PCA) of the expression profiles of the 500-most variable genes. Railway and mountain populations group closely together by site-type. (D) Correlation analysis between FLC average expression and average non-vernalized (NV) flowering time. The linear regression model after exclusion of BGS is plotted in solid black. Grey area represents the 95% predicted confidence intervals around regression line. Dotted lines are the residual (orthogonal distance) for each data point from the regression line. The p-value for the likelihood to obtain a residual as observed with BGS from residual distribution is indicated as p(BGS).

