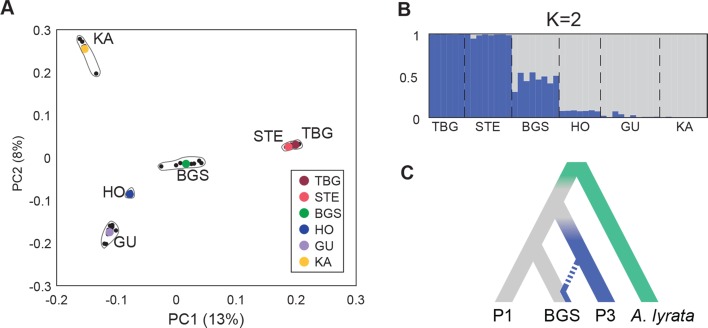
Fig 4. BGS shares genomic variation with lowland railway and mountain backgrounds.
(A) First two principal components (PC1 and 2 with percentage of variance explained) of Principal Component Analysis (PCA) of the genomes from 47 re-sequenced individuals of three railway (TBG, STE, BGS) and three mountain (HO, GU, KA) populations. (B) Genomic clustering of individuals using STRUCTURE with K = 2. Each individual is represented by a single vertical line broken into K = 2 segment with length of each colored bar proportional to the posterior probability of belonging to each cluster. (C) Population history model used for ABBA-BABA evaluation of introgression fraction within BGS, with background and donor populations P1 and P3 and A. lyrata used as outgroup.

