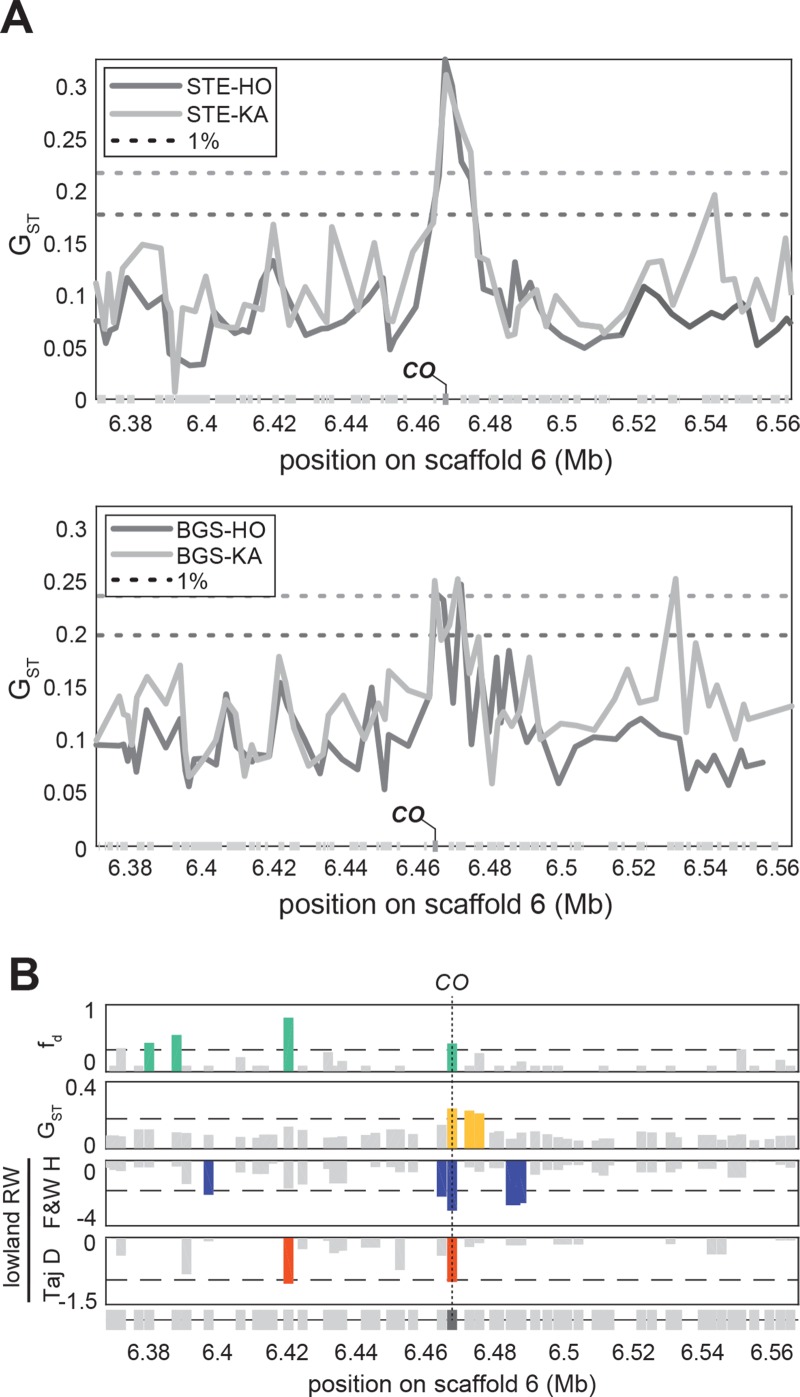
Fig 5. Railway-specific selection on a highly-differentiated railway haplotype of CONSTANS.
(A) Marks of differentiation between one lowland railway population STE (upper panel) or BGS (lower panel) and two mountain populations (HO and KA) evaluated with GST across CO region. Dotted lines are respective genome-wide 1% threshold levels. (B) Gene-wise marks of introgression (), railway-mountain differentiation (GST), and railway-specific positive selection (Fay & Wu’s H, and Tajima’s D) across CO region. For each gene, only the least extreme values are represented. Dotted lines are (upper panel) or most extreme genome-wide 5% threshold levels.

