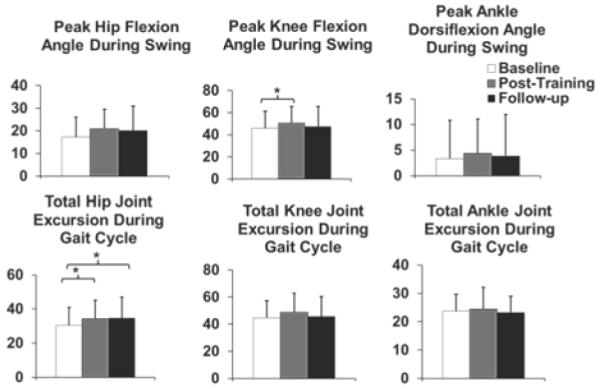
Fig. 4.

Peak hip and knee flexion angles and peak ankle dorsiflexion angle (degrees) during the swing phase and total hip, knee, and ankle joint excursion (degrees) during the gait cycle averaged across subjects for the paretic leg. Error bars represent the standard deviation across subjects. * p<0.017
