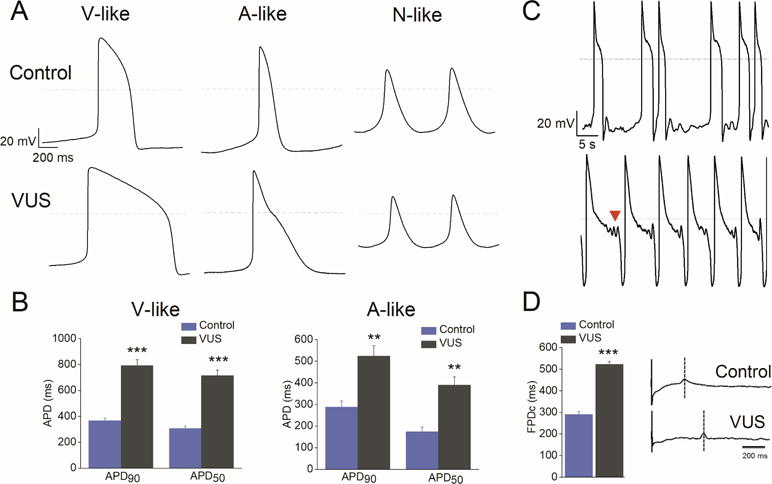
Figure 2. Patient-specific VUS iPSC-CMs exhibit characteristic LQTS signatures.

(A) AP recordings from control and VUS iPSC-CMs showing ventricular (V)-like, atrial (A)-like, and nodal (N)-like morphologies. Notice the marked APD prolongation in both V-like and A-like VUS iPSC-CMs. (B) The action potential duration (APD) measured at 50% (APD50) and 90% repolarization (APD90) in VUS (grey, n = 119) and healthy control (blue, n = 49) A-like and V-like iPSC-CMs. ***p<0.001 when compared to control cells. Error bars show S.E.M. (C) Development of spontaneous arrhythmogenicity in VUS iPSC-CMs manifested as beat irregularity (top) or EADs indicated by arrowhead (bottom). (D) Left panel, summary of rate-matched Fridericia’s corrected field potential duration (FPDc) values of VUS iPSC-CMs (grey, n = 7) and healthy control (blue, n = 7). FPDc = FPD/(Beat Period)^0.3333. Error bars show S.E.M. ***p<0.001. Right panel, representative MEA recordings from healthy control (top) and VUS (bottom) iPSC-CM monolayer.
