Figure 3. Comparison of single neuronal activity in the striatum and the cerebellar nucleus during the self-timed saccade task.
(A) A representative neuron in the caudate nucleus showing a ramp-up of activity during the delay period. Trials are sorted by saccade latency, and the rasters and corresponding spike density are shown for saccades in contralateral direction. Green, blue, and orange traces indicate data for short, medium, and long mandatory intervals, respectively. (B) A representative neuron in the cerebellar dentate nucleus. Data are shown for saccades in ipsilateral direction. (C) Time courses of the population activity for neurons in the caudate nucleus. Traces are the means of spike densities for individual neurons and are aligned on the cue onset (vertical line). Continuous and dashed traces indicate data for saccades in contralateral and ipsilateral directions, respectively. The filled and open triangles with horizontal bars indicate the mean ± SD of average saccade latency for contralateral and ipsilateral directions in each session, respectively. (D) Time courses of the population activity for neurons in the dentate nucleus. The population data in both structures aligned with saccade initiation are shown in Figure 3—figure supplement 1.
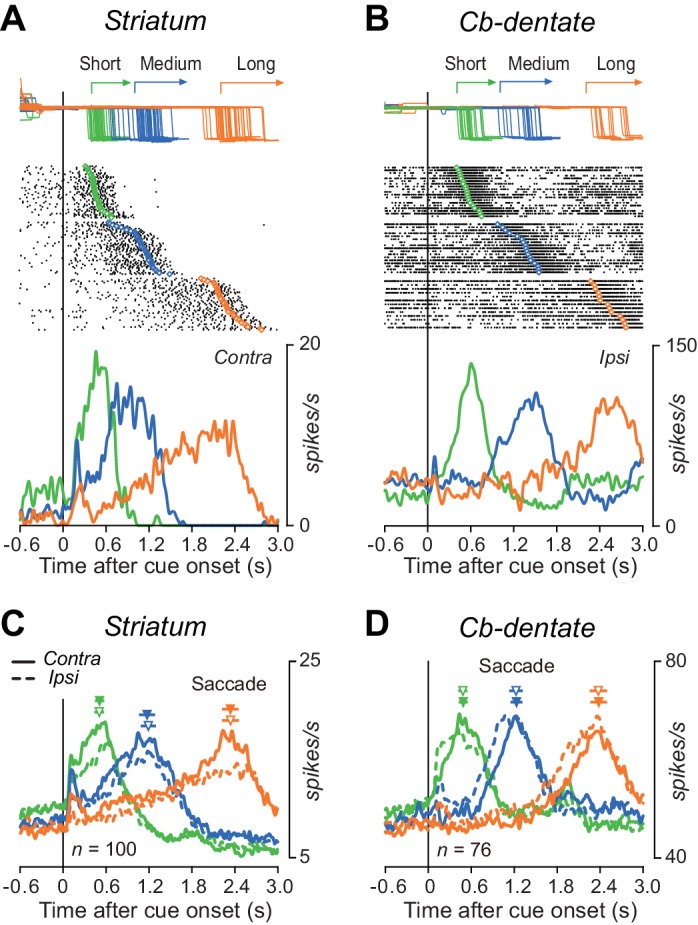
Figure 3—figure supplement 1. Time courses of the population activity aligned with saccade initiation.
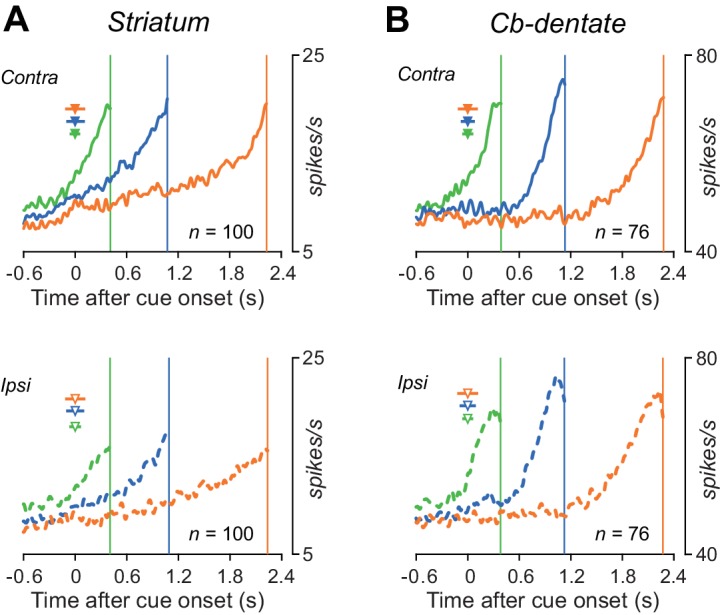
Figure 3—figure supplement 2. Matrix of inter-neuronal correlation.

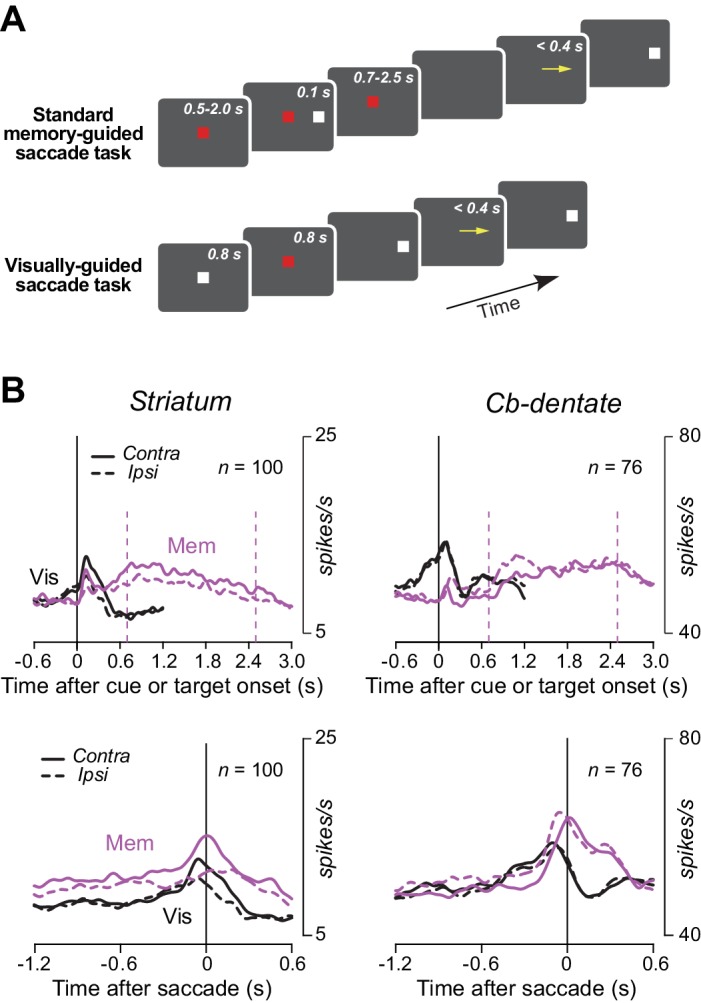
Figure 3—figure supplement 3. Neuronal activity during the standard memory-guided saccade task and the visually-guided saccade task.