
Figure 4. Quantitative analysis for the time course of ramping activity during the delay interval.
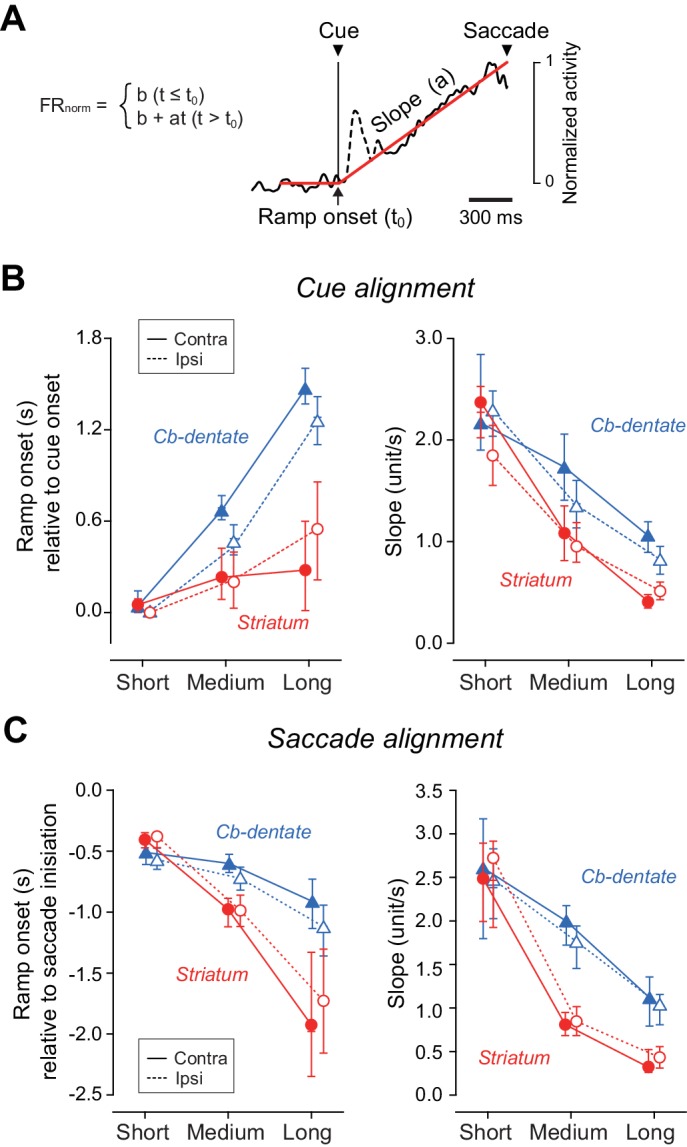
(A) An example illustrating how we measured the onset and slope of ramp-up activity. For each condition, the trace of population of normalized activity (starting from 300 ms before cue onset and ending at the mean saccade latency) was fitted with two lines defined by three parameters (least squares, red lines). Data during 200 ms following 50 ms after cue onset were excluded to remove visual transients (dashed line). (B) Summary of ramp onset (left panel) and ramp-up slopes (right panel) for neurons in the striatum (n = 100, red circles) and the cerebellar nucleus (n = 76, blue triangles) based on data aligned with cue onset. Each data point indicates the values computed from the population data. Error bars with tick marks denote 2.5, 50 and 97.5 percentile of the results of the bootstrap analysis. Data points connected with solid and dashed lines indicate the data for ipsiversive and contraversive saccades, respectively. (C) Summary of ramp onsets (left panel) and slopes (right panel) computed for the data aligned with saccade initiation. Note that ramp onsets and slopes for the medium and long delay conditions differed significantly between the striatum and cerebellum.