
Figure 7. Effects of inactivation.
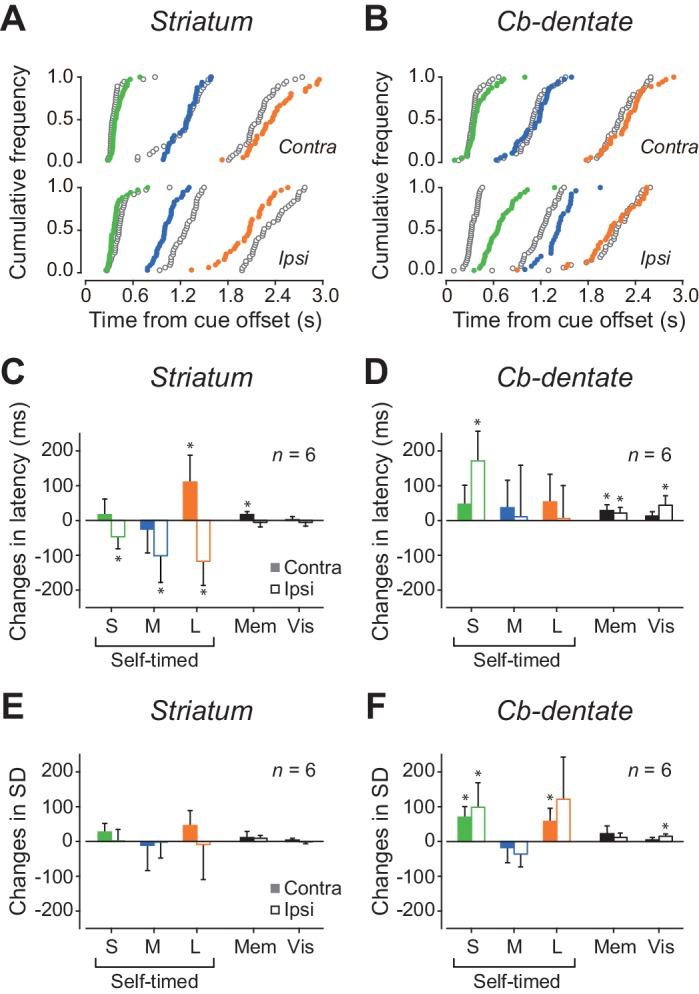
(A) Data from a representative experiment in the caudate nucleus. Cumulative distributions of saccade latencies are compared between trials before (black open circles) and during (colored circles) inactivation with muscimol. Different colors indicate different mandatory delay intervals. (B) A representative experiment in the cerebellar dentate nucleus. Note that inactivation effects were greatest for ipsiversive trials with short mandatory intervals. (C) Summary of inactivation effects on saccade latency for the caudate nucleus. Bars and whiskers indicate the means and 95% confidence intervals of the changes in median latencies for different conditions. Filled and open bars indicate the data for contraversive and ipsiversive saccades, respectively. Asterisk denotes a significant inactivation effect (paired t-test, p<0.05). (D) Inactivation effects on saccade latency in the cerebellar nucleus. (E, F) Summary of inactivation effects on variation of saccade latency for the caudate nucleus and the cerebellar nucleus, respectively. SD, standard deviation.