. 2018 Jul 17;7:e34803. doi: 10.7554/eLife.34803

Figure 3. Expression differences in NDP, but not EFHC2, indicate cis-regulatory differences associated with pigmentation phenotypes.

(A) qRT-PCR assays demonstrate higher expression of NDP in regenerating feathers of checker and T-check birds than in bar birds. Expression levels of EFHC2 are indistinguishable between bar and melanistic phenotypes (p=0.19), although checker and T-check differed from each other (p=0.046). (B) Allele-specific expression assay in regenerating feathers from heterozygous bar/checker birds for NDP and EFHC2. Copies of the CNV region on the checker chromosome were quantified using a custom Taqman assay. Boxes span the first to third quartiles, bars extend to minimum and maximum observed values, black line indicates median. Expression of EFHC2 alleles were not significantly different, and checker alleles of NDP showed higher expression than the bar allele; p=0.0028 for two-sample t-test between 1 vs. 4 copies, p=1.84e-06 for glm regression.

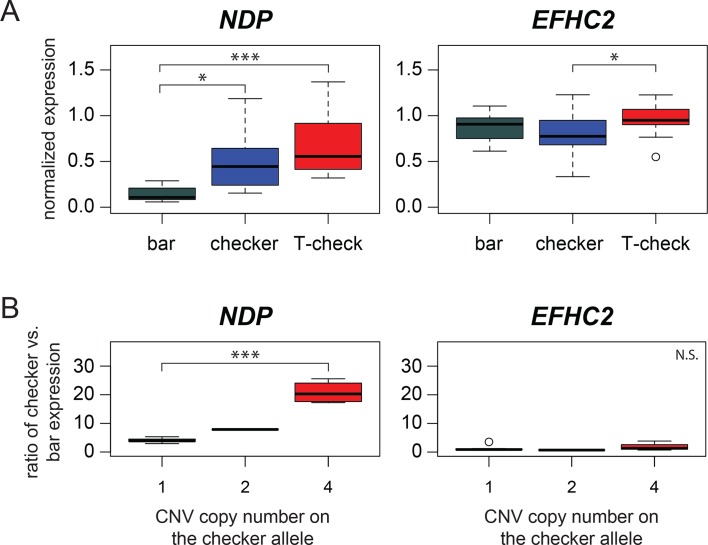
Figure 3—source data 1. qRT-PCR source data represented in Figure 3A, and Figure 3—figure supplement 1.
elife-34803-fig3-data1.xlsx (128.2KB, xlsx)
DOI: 10.7554/eLife.34803.016
Figure 3—source data 2. Allele-specific expression assays source data represented in Figure 3B and Figure 3—figure supplement 3.
DOI: 10.7554/eLife.34803.017

Figure 3.

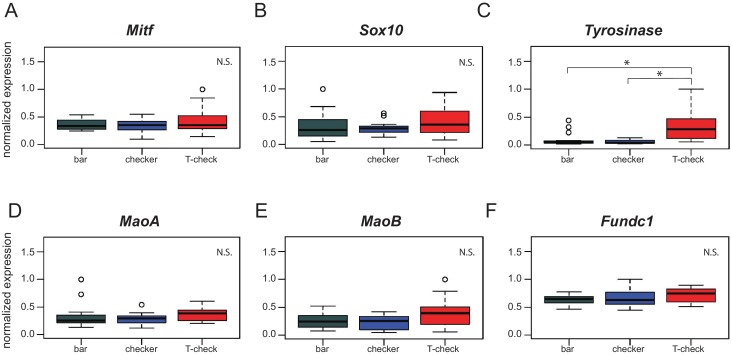
Figure 3—figure supplement 1. Expression of genes involved in pigmentation and genes in the candidate region.

Figure 3—figure supplement 1.

Expression levels of Mitf (A), Sox10 (B), MaoA (D), MaoB (E), and Fundc1 (F) are indistinguishable across phenotypes. (C) Tyrosinase shows increased expression in T-check birds relative to bar (p=2.4e-04) and checker birds (p=3.8e-05). Boxes span the first to third quartiles, bars extend to minimum and maximum observed values, black line indicates median. Expression values are analyzed by Pairwise Wilcoxon test (p-value adjustment method: fdr).
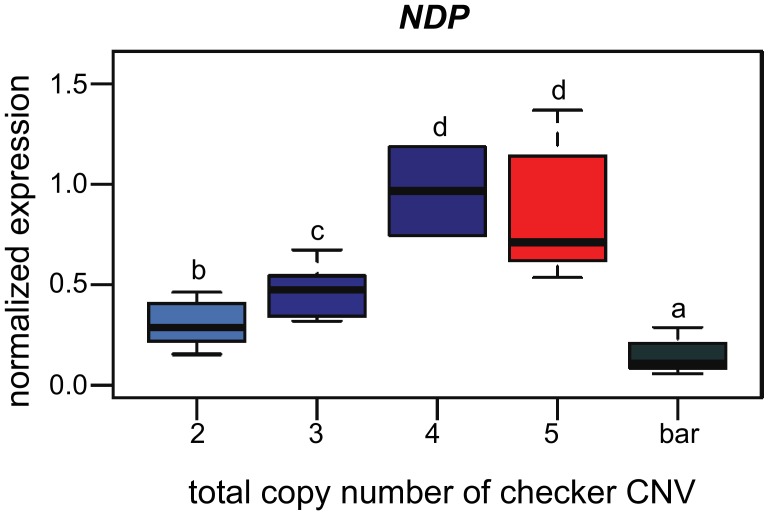
Figure 3—figure supplement 2. NDP expression varies by copy number and phenotype.

Figure 3—figure supplement 2.

qRT-PCR expression assay for NDP (Figure 3A) is parsed by copy number in the CNV region. All checker (blue) and T-check (red) birds, except for the single individual with four total copies (dark blue), are heterozygous for bar. Increase in NDP expression is correlated with increasing numbers of copies of the CNV region. Boxes span the first to third quartiles, bars extend to minimum and maximum observed values, black line indicates median. Different letters indicate significant pairwise differences. Pairwise Wilcoxon test (p-value adjustment method: fdr) results by copy number: 2–3 copies, p=0.03788; 2–4 copies, p=0.04938; 2–5 copies, p=0.00015; two copies-bar, p=0.00432; 3–4 copies, p=0.03788; 3–5 copies, p=0.00122; three copies-bar, p=1.9e-06; 4–5 copies, p=0.48485; four copies-bar, p=0.02179; five copies-bar, p=1.9e-06.
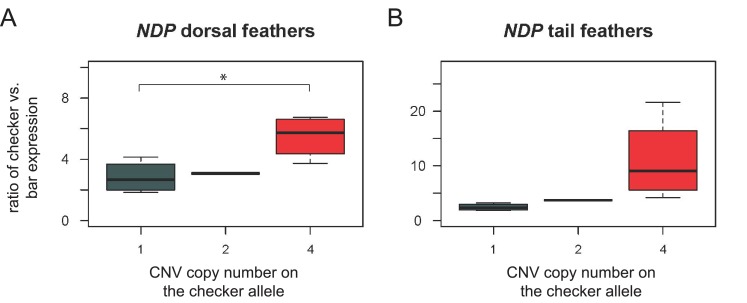
Figure 3—figure supplement 3. Allele-specific expression assay for NDP in regenerating feathers from dorsal body and tail feathers.

Figure 3—figure supplement 3.

Copies of the CNV region on the checker chromosome were quantified as in Figure 3B. (A) In dorsal body feathers, checker alleles of NDP showed higher expression than the bar allele (p=0.025 for two-sample t-test comparing 1-copy checker:bar ratio to 4-copy checker:bar ratio, p=0.013 for glm regression including 1-, 2-, and 4-copy checker:bar ratios). Expression ratios of 1-copy checker:bar and 4-copy checker:bar alleles were significantly different from the 1:1 value expected for equal checker and bar expression; p<0.05 for each comparison. (B) Ratio of expression in tail feathers was not significantly different between checker alleles with 1 or four copies (p=0.11, t-test; p=0.044 for glm regression including 1-, 2-, and 4-copy checker:bar ratios). Expression ratios of 1-copy checker:bar were significantly different from the 1:1 value expected for equal checker and bar expression; p<0.05. Expression ratios of 4-copy checker:bar alleles were not significantly different from the 1:1 value expected for equal checker and bar expression; p=0.07. Boxes span the first to third quartiles, bars extend to minimum and maximum observed values, black line indicates median.