. 2018 Jul 17;7:e34803. doi: 10.7554/eLife.34803

Figure 5. Signatures of introgression of the checker haplotype from C. guinea to C. livia.

(A) ABBA-BABA test with C. livia (bar), C. livia (checker), C. guinea, and C. palumbus shows elevated D-statistic in the Scaffold 68 candidate region. Three representative ABBA-BABA tests are shown and dashed red line marks the genome-wide mean D-statistic for 10 × 10 different combinations of bar and checker birds (ARC-STA, MAP-ORR, IRT-STA are shown, where ARC, MAP, and IRT are checker samples and STA and ORR are bar samples; see Methods). (B) HybridCheck shows pairwise sequence similarity across informative sites of a sequence triplet. A representative triplet of bar (Fer_VA), checker (ARC), and C. guinea comparison is shown. Blue trace shows sequence similarity between bar and checker, purple trace shows similarity between bar and C. guinea, and yellow trace shows sequence similarity between checker and C. guinea. (C) Expected (purple bar) and observed proportion of shared segregating sites out of 4261 total SNPs in the minimal haplotype region for different pairwise comparisons between and among 16 bar, 11 checker, and 1 C. guinea. (D) Speckled pigeon (Columba guinea). Photo courtesy of Kjeuring (CC BY 3.0 license, https://creativecommons.org/licenses/by/3.0/legalcode). Photo cropped from ‘speckled pigeon Columba guinea Table Mountain Cape Town,’ https://en.wikipedia.org/wiki/Speckled_pigeon#/media/File:Speckledpigeon.JPG. Inset feather image by the authors.

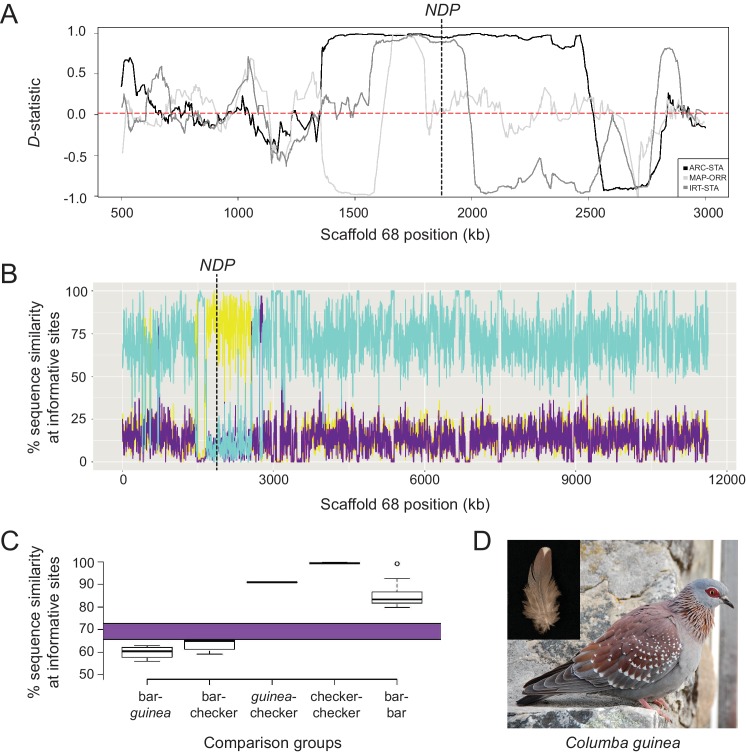
Figure 5—source data 1. Numbers of SNPs between different pairwise combinations of homozygous bar, checker, and C. guinea represented in Figure 5C.
DOI: 10.7554/eLife.34803.021

Figure 5.

Figure 5—figure supplement 1. Expected (purple bar) and observed proportion of shared segregating sites out of 1,458 SNPs in the minimal haplotype region for different pairwise comparisons between de novo genome assemblies from short-read resequencing data for bar, checker, and C. guinea.

Figure 5—figure supplement 1.

Filled circles denote sequence similarity in pairwise comparisons of de novo assemblies, and diamonds denote pairwise comparisons between de novo assemblies and the reference assembly, which has the checker haplotype. Percent similarity is much lower in this plot than in Figure 5C because the number of polymorphisms between pairwise comparisons is similar, but the total number of segregating sites is much lower in this small dataset than in the comparison among many resequenced genomes. In the larger dataset depicted in Figure 5C, the higher number of SNPs was driven largely by sequence diversity among the 16 bar birds. We identified 105 SNPs in the de novo assemblies that we not called in the resequencing data. Of these, 31 differ in the pairwise comparison between the checker and C. guinea assemblies, 84 differ between checker and bar, and 98 differ between bar and C. guinea. Total polymorphic sites between de novo assemblies in the 92,199 bp intersection among all three de novo assemblies: bar-checker, 1343; checker-C. guinea, 212; bar-C.guinea, 1361. Total polymorphic sites between de novo assemblies and the reference (checker) genome: bar-reference, 1342; checker-reference, 11; C. guinea-reference, 205.