
Fig. 10.
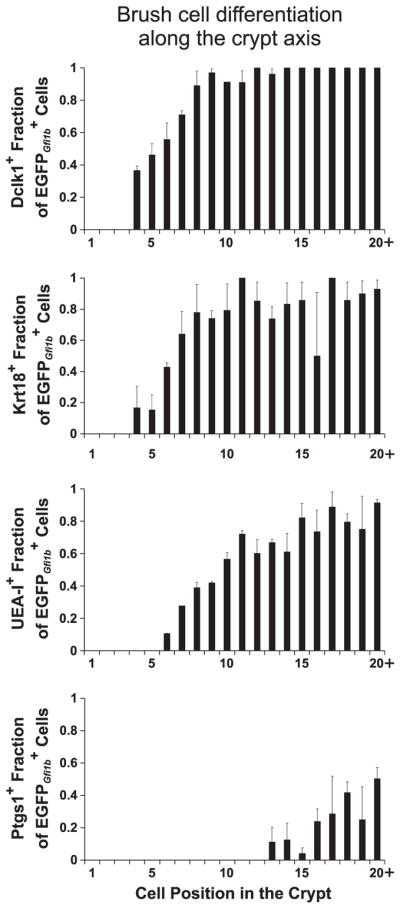
Graphs showing the accumulation of various brush cell differentiation markers as cells mature during their migration up the crypt towards the villus (mean±S.E.M.). The data was derived from crypts isolated from 3 Gfi1bEGFP/+ mice. The distributions were determined by scoring the following total numbers of cells: Dclk1+ (435), Krt18+ (386), UEA-I+ (626), and Ptgs1+ (283).