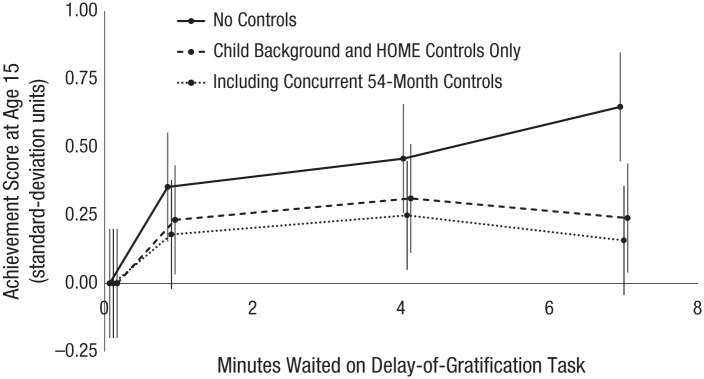
Fig. 1.
Predicted achievement score by minutes of delay for children of mothers with no college degree. Error bars represent 95% confidence intervals. Values are shown separately for each of the four delay-of-gratification groups (< 0.333 min, 0.333–2 min, 2–7 min, 7 min); the x-axis shows the deviation in achievement composite scores from the reference group (delay < 0.333 min) against the within-group average amount of time waited. The average wait times for the models with no controls and with child background and Home Observation for Measurement of the Environment (HOME) controls only are displaced by ±.025 to distinguish the sets of error bars. The high-delay group’s coefficients are plotted at 7 min, although the 7-min truncation prevents us from knowing what the mean value of minutes waited would have been for this group in the absence of this limit.

