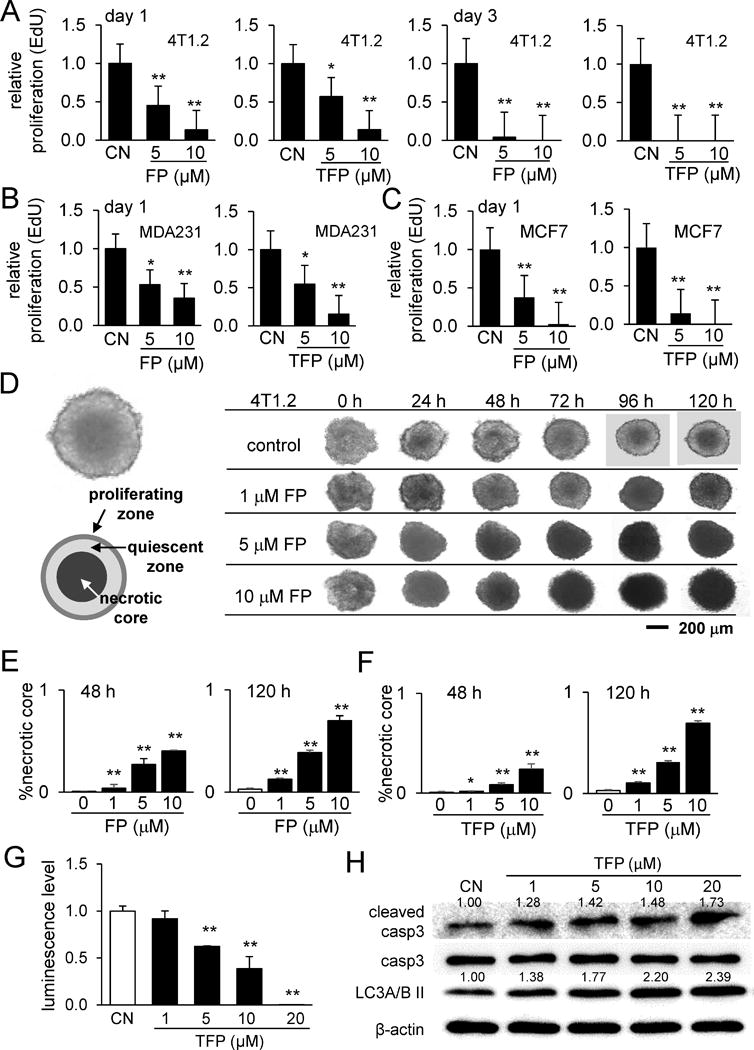
Figure 3.

Responses of tumor cells (4T1.2 cells, MDA-MB-231 cells, and MCF7 cells) to Fluphenazine and Trifluoperazine. Of note, CN = control, FP = Fluphenazine, and TFP = Trifluoperazine. The single and double asterisks indicate p < 0.05 and p < 0.01, respectively. (A-C) EdU-based relative proliferation of 4T1.2 cells, MDA-MB-231 cells, and MCF cells, respectively. (D) Temporal alterations in morphology of 4T1.2 spheroids in response to 1, 5, and 10 μM Fluphenazine in 24, 48, 72, 94, and 120 h. (E&F) Increased relative area of the necrotic core by Fluphenazine and Trifluoperazine, respectively. (G) Decrease in 3D cell viability by 10 and 20 μM Trifluoperazine. (H) Elevation of the cleaved caspase 3 (marker for apoptosis) and Lc3A/B II (marker for autophagy) in response to Trifluoperazine.
