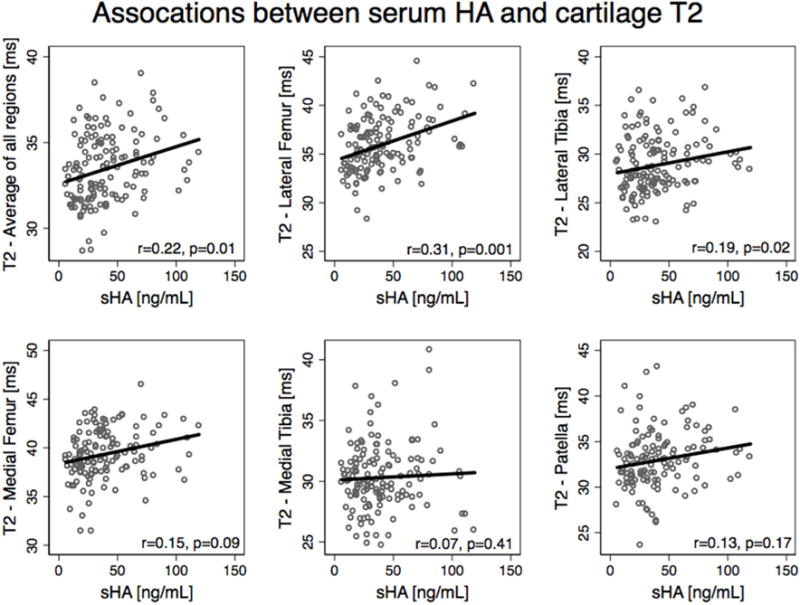
Figure 1.

Scatterplots with a line fit using linear regression illustrate the associations between sHA and Cartilage T2. Partial correlations are listed with adjustments for age, gender, BMI, diabetes status, KL grade in both knees, and JSN over 2 years in both knees).
