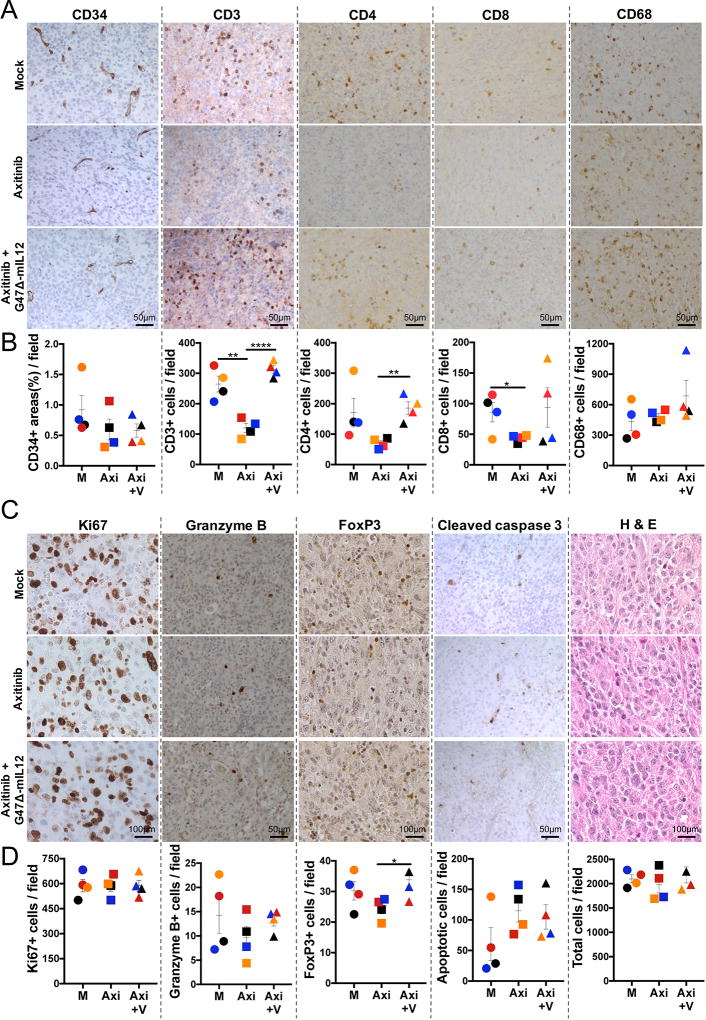
Figure 6. Immunohistochemical staining of cell markers in brain tumor sections.
C57Bl/6 mice implanted with 005 GSCs (2 × 10⁴) on day 0 were injected intratumorally with G47Δ-mIL12 (1 × 10⁵ pfu) or PBS on days 18 and 24 and intraperitoneally with axitinib (25 mg/kg) or vehicle from days 21 to 25. Six hours after the last axitinib injection, animals were sacrificed and brains collected. Brain tumor sections were stained for CD34, endothelial cells; CD3, T cells; CD4, T cells; CD8, T cells; CD68, macrophages; Ki67, proliferating cells; Granzyme B, cytotoxic cells; FoxP3, regulatory T cells; cleaved caspase-3, apoptotic cells; and H & E (for total cell count). A, C. Representative images with positive cells stained brown. B, D. Scatter plots (each animal 1 point) showing the quantification of CD34+ areas (10× objective, 3 fields/tumor section, 3 sections/mouse), CD3+ (10× objective, 3 fields/section, 3 sections/mouse), CD4+ (10× objective, 5 fields/section, 1 section/mouse), CD8+ (10× objective, 5 fields/section, 1 section/mouse), CD68+ (20× objective, 5 fields/section, 1 section/mouse), Ki67+ cells (20× objective, 3 fields/section, 3 sections/mouse), Granzyme B+ (10× objective, 3 fields/section, 3 sections/mouse), FoxP3+ (20× objective, 3 fields/section, 3 sections/mouse), cleaved caspase-3+ (10× objective, 3 fields/section, 3 sections/mouse), and cell density count (20× objective, 3 fields/section, 1 section/mouse). Individual mice in each group (mock, M; axitinib, Axi; and axitinib+ G47Δ-mIL12, Axi+V) identified by color. Mean ± SEM. * P<0.05, ** P<0.01, **** P<0.0001. Quantification of CD34+ areas was done by ImageJ software (NIH). Counter was blinded to the experiment.

