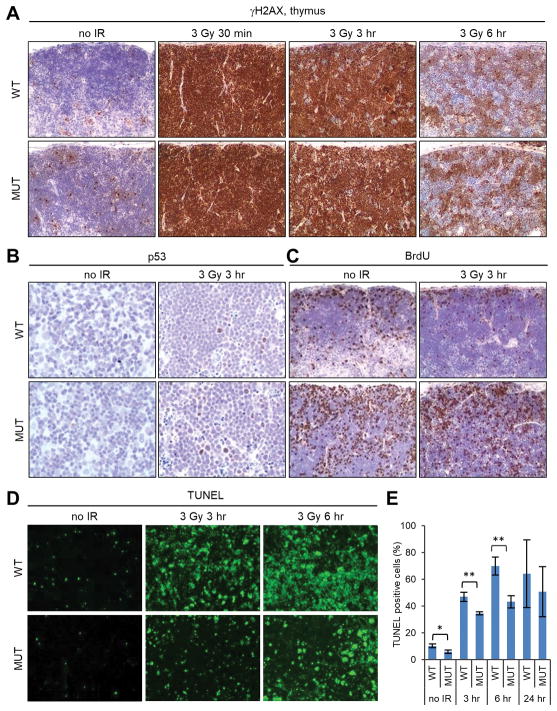
Figure 5.
DNA damage response in the thymus of wt and Palb2 mutant mice. (A-C) Representative IHC images of γH2AX (A), p53 (B) and BrdU incorporation (C) before and after 3 Gy of IR. (D,E) Representative images of TUNEL staining and quantification of TUNEL-positive cells (E) before and after 3 Gy of IR. Data shown are means ± SD from 3 independent experiments. *, p<0.05; **, p<0.01.

