Figure 6.
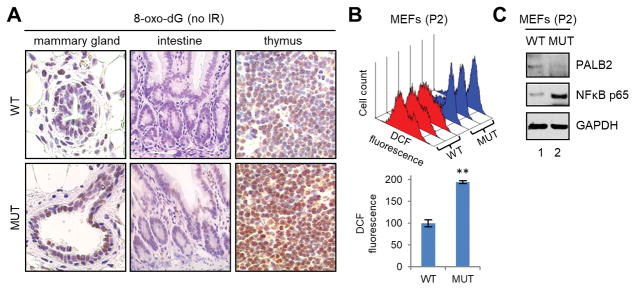
Evidence of increased oxidative stress in Palb2 mutant mice. (A) Representative IHC images of 8-oxo-dG in the mammary gland, intestine and thymus of wt and mutant mice. (B) ROS levels in wt and mutant primary MEFs at passage 2. Top panel, DCF fluorescence histograms of 3 pairs of wt (red) and mutant (blue) cells; lower panel, combined DCF fluorescence values of the 3 pairs of cells. (C) Representative western blots showing PALB2 and NFκB p65 levels in wt and Palb2 mutant MEFs.

