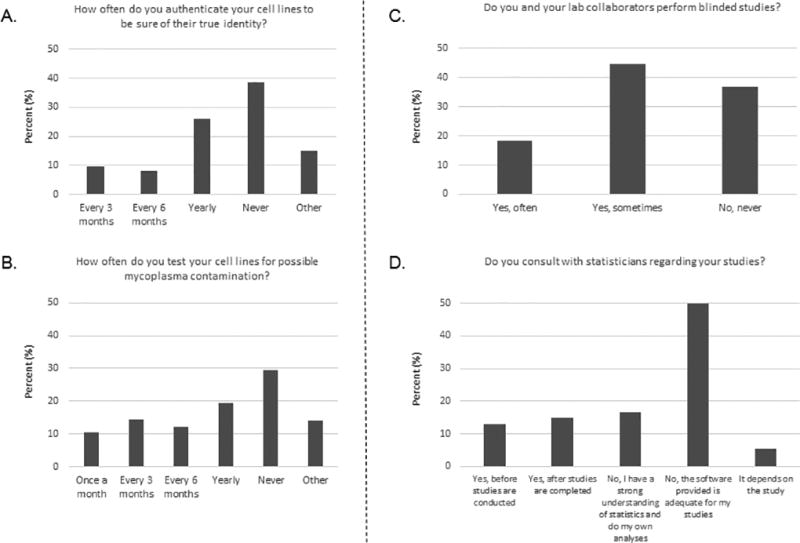
Fig 2. Responses to questions about best research practices.

A. Responses to question 13. Among the 465 respondents, 112 responded “other” and explained it as “not applicable.” This graph represents the responses of the 353 other respondents. B. Responses to question 14. Among the 465 respondents, 121 responded “other” and explained it as “not applicable.” This graph represents the responses of the 344 other respondents. C. Responses to question 18. Among the 467 respondents, 14 responded “other” and explained it as “not applicable.” This graph represents the responses of the 453 other respondents. D. Responses to question 12. When the answer given was “other, please explain,” the comments provided by these respondents were either extrapolated to fit into one of the original categories or used create the new category “It depends on the study.” All 467 respondents answered this question, but 15 of the “other” responses did not fit into any of the existing categories or the new category. This graph represents the responses of 452 other respondents.
