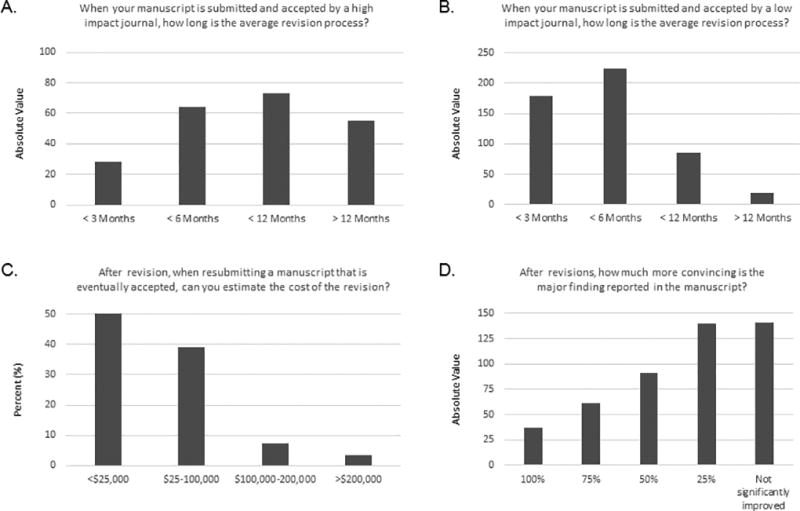
Fig 4. Responses to questions about the publication process.

A. Responses to question 22. Among the 467 respondents, 285 responded “other” and explained it as “not applicable.” This graph represents the responses of the 182 other respondents. Because several answers could be selected, the data are shown as absolute values of all responses selected (220 total). B. Responses to question 23. Among the 467 respondents, 43 responded “other” and explained it as “not applicable.” This graph represents the responses of the 424 other respondents. Because several answers could be selected, the data are shown as absolute values of all responses selected (506 total). C. Responses to question 26. Among the 454 respondents, 206 responded either “not applicable” or “don't have access to information necessary to provide an estimate.” This graph represents the responses of the 248 other respondents. D. Responses to question 25. Among the 467 respondents, 53 responded “other” and explained it as “not applicable.” This graph represents the responses of the 414 other respondents. Because several answers could be selected, the data are shown as absolute values of all responses selected (470 total).
