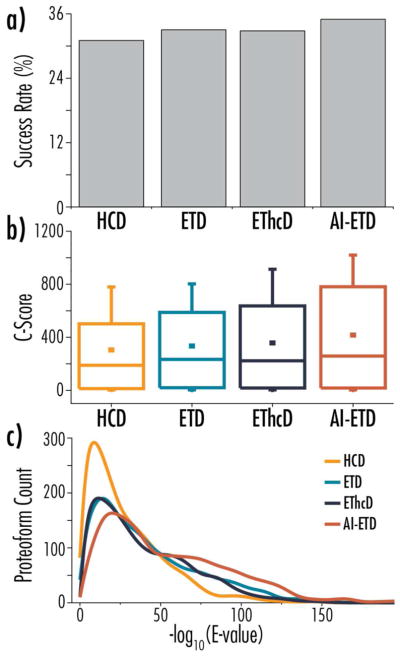
Figure 2.
Panel (a) shows MS/MS success rates for each of the four dissociation methods, where success rate is defined as the percentage of MS/MS scans that converted to a proteoform identification. Panels (b) and (c) compare C-score and -log(E-value) distributions, respectively, for HCD, ETD, EThcD, and AI-ETD analyses.

