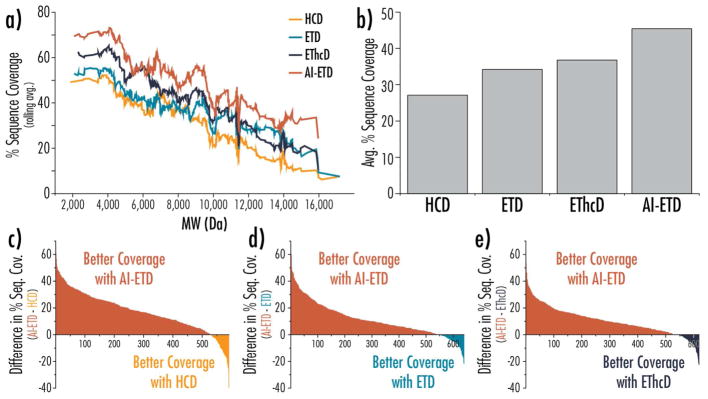
Figure 4. Four-way and binary comparisons of proteoform fragmentation methods.
a) Percent sequence coverage is plotted as a function of precursor molecular weight, where the percent sequence coverage is calculated as a rolling average of the 50 subsequent sequence coverage values. b) The average percent sequence coverage for all proteoform identifications based on dissociation method. Differences in sequence coverage for proteoforms seen with AI-ETD and (c) HCD, (d) ETD, and (e) EThcD are plotted in rank order, where a positive value indicates a higher sequence coverage seen with AI-ETD (colored in red). In all cases, AI-ETD offered superior sequence coverage for approximately 85% of the proteoforms. Note, the value along the x-axes in panels (c–e) indicate the number of unique proteoforms identifications overlapping between AI-ETD and the given dissociation method.

