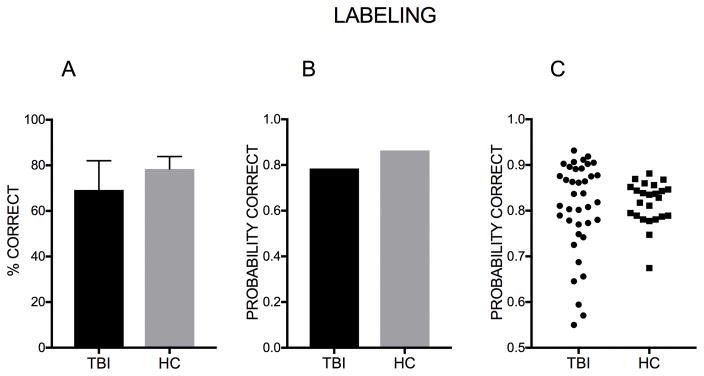
Figure 3. Probability of correct response – Group comparison (Labeling).
A. Percent of correct response. Error bars represent the standard deviation. B. Mean probability of giving the correct response to the average item in the labeling task for the TBI group and for the HC group. C. Each data point represents a participant’s probability to respond correctly.

