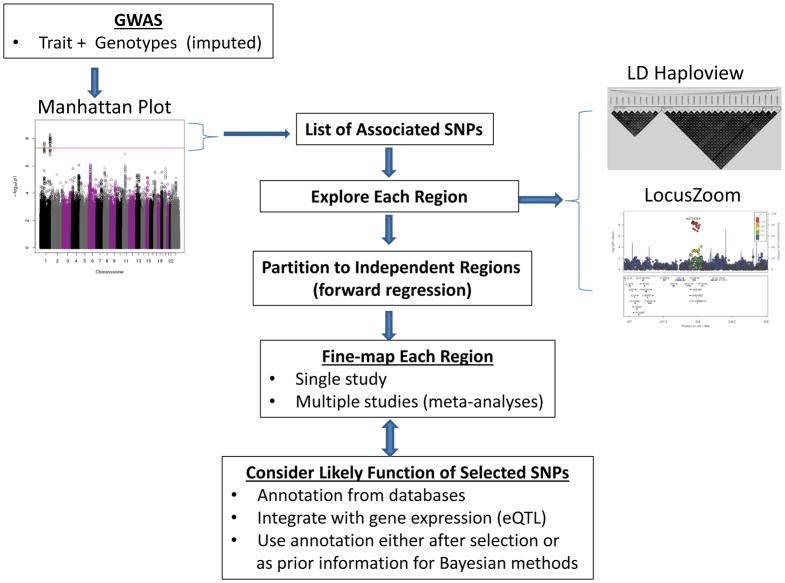
Figure 1. Flow of typical process from intial GWAS to annotation of SNPs selected from fine-mapping analyses.
Based on GWAS p-values summarized in a Manhattan plot112, a list of SNPs that achieve genome-wide statistical significance (i.e., p-value <5×10⁻⁸) is used to determine regions of interest for fine-mapping. Each region is typlically explored according to the structure of linkage disequilibrium among single-nucleotide polymorphisms (SNPs) using Halpoview plots. Statistical assocaitions are viewed with LocusZoom plots that illustrate the patterns of association of each SNP with the lead SNP, as well as annotation of genes in the region. The regions can then be partitioned into independent sub-regions to ease computational burden, based on statistical models that evalute the simultaneous effects of multiple SNPs on a trait. Statistical fine-mapping is conducted in each region, using one of the methods illusrated in Figure 2. The SNPs selected from fine-mapping are then annotated with genomic features to prioritize follow-up functional studies. Figure is adapted from REF112.

