
FIGURE 1.
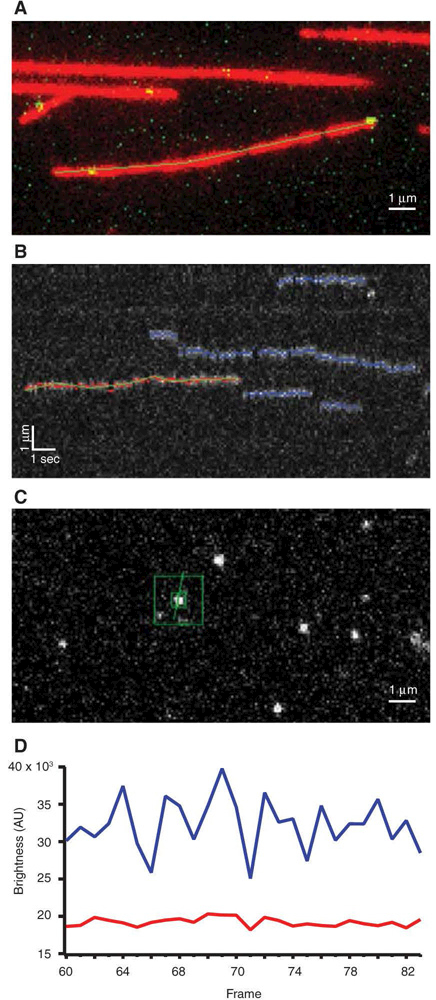
TIRF data analysis. (A) Overlapping green and red channels depict a microtubule (red) that was traced by hand using a multisegmented tool. Yellow spots show GFP-tagged proteins binding to the microtubule. (B) Kymograph created from a traced microtubule as in A. Red dots and green line indicate the currently selected binding event, blue lines show previously selected events, and untraced events are shown in gray. (C) Particle brightness is computed at each time point of event from B. Integrated brightness is measured using small green box surrounding particle and larger green box is used to calculate background intensity. (D) Example plot of pixel brightness (blue trace) and background level (red trace) over time generated from C.