Figure 5.

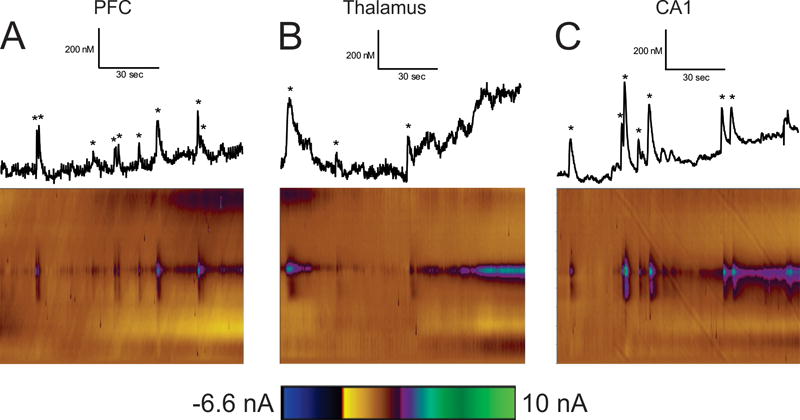
Concentration changes (top) and 3D color plots (bottom) for the (A) PFC, (B) thalamus, and (C) CA1 when treated with 100 nM DPCPX. Verified adenosine transients are marked with a star in the concentration traces.

Concentration changes (top) and 3D color plots (bottom) for the (A) PFC, (B) thalamus, and (C) CA1 when treated with 100 nM DPCPX. Verified adenosine transients are marked with a star in the concentration traces.