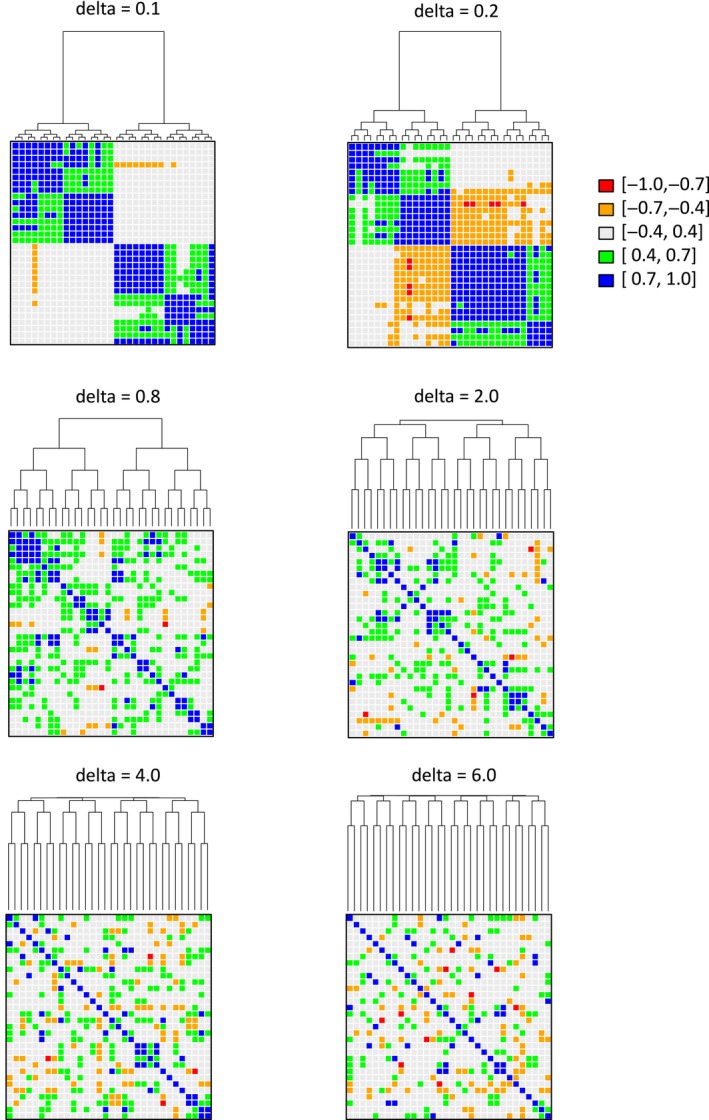
Figure 2.

Heatmaps of allele frequency correlations between pairs of populations for different δ values. Delta values control the strength of the spatial genetic structure among populations with low δs having the strongest spatial correlation among populations. Each heatmap represents the outcome of a single simulation and each dot represents the allele frequency correlation between two populations. Thus, the diagonal represents the correlation of a population with itself and is always 1 regardless of the δ value considered in the simulation. Colours indicate range of correlation values. As in Figure 1, the dendrograms represent the spatial relationship (i.e., geographic distance) between populations
