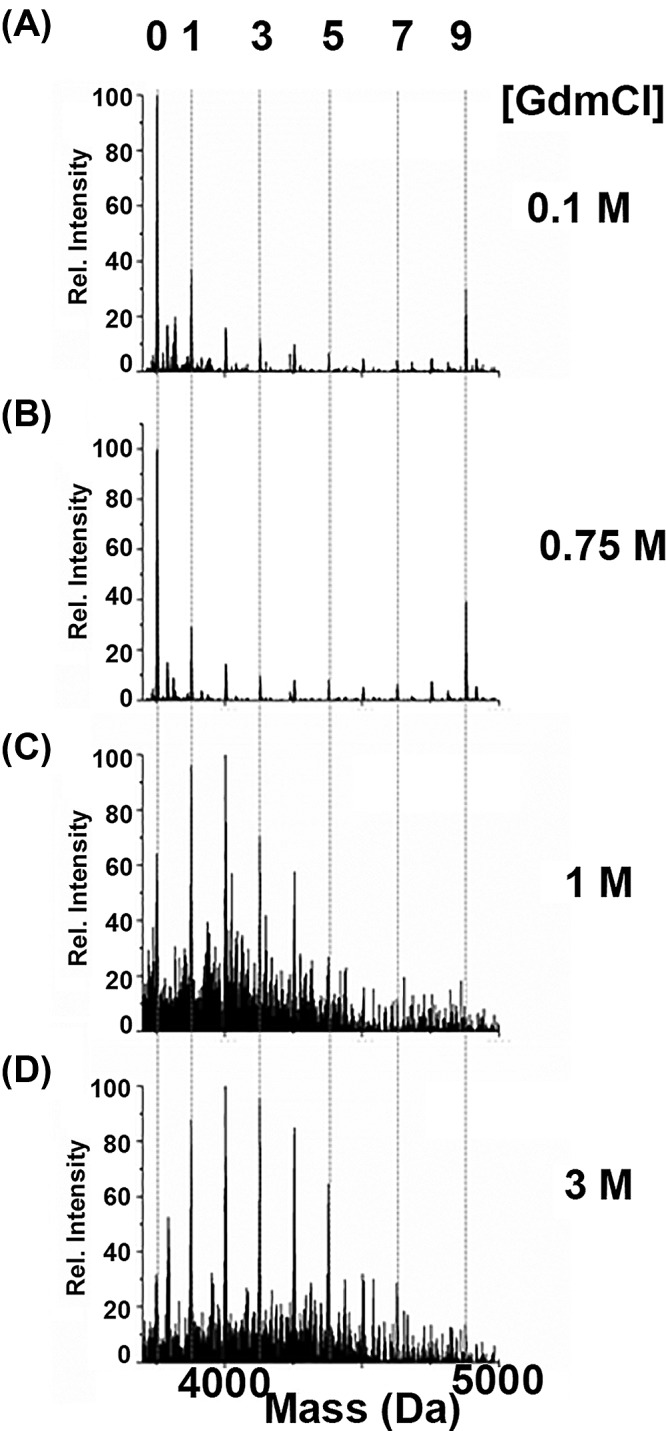
Figure 1. Representative deconvoluted ESI-mass spectra of the alkylated apo-βMT with approximately 3 mol. eq. NEM at pH 7.4 in the presence of increasing concentrations of GdmCl.

The deconvoluted mass spectra of apo-βMT reacted in aqueous solutions of (A) 0.1, (B), 0.75, (C) 1, and (D) 3 M GdmCl are presented. The reaction profiles in (A) and (B) are representative of the folded protein and those of (C) and (D) are typical of the unfolded protein. The numbers on the top x-axis indicate the number of NEM-modified cysteines and the dashed lines indicate the corresponding mass of the modified species and help guide the eye.
