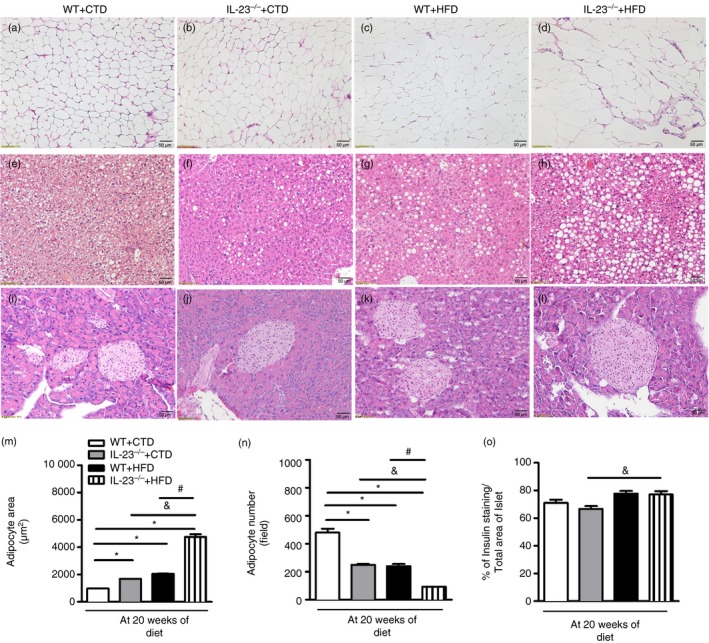
Figure 2.

Histopathological analysis of the visceral adipose tissue (VAT), liver and pancreatic tissues of wild‐type (WT) and interleukin‐23 p19‐deficient (IL‐23p19–/–) mice fed a control diet (CTD) or a high‐fat diet (HFD) for 20 weeks. Adipocyte hypertrophy was assessed in VAT of mice on HFD or CTD (a–d). Hepatic steatosis was assessed in liver of mice on HFD or CTD (e–h). Histological analysis of inflammatory infiltrate into pancreatic islets stained with haematoxylin & eosin (i–l). Morphometric quantification of adipocyte size (m) or numbers was performed in adipose tissue (n). A quantitative analysis of insulin‐producing β cell expression was performed into pancreatic islets immunostained with insulin‐specific antibody (o). The images are representative of a single experiment repeated three times (original magnification 200×). Asterisks represent statistically significant differences (*P < 0·05) compared with WT on CTD; (# P < 0·05) compared with WT on HFD; (& P < 0·05) compared with IL‐23p19–/– mice on CTD. Significant differences between the groups were compared by one‐way analysis of variance followed by Tukey's multiple‐comparison test. The results are representative of a single experiment repeated three times.
