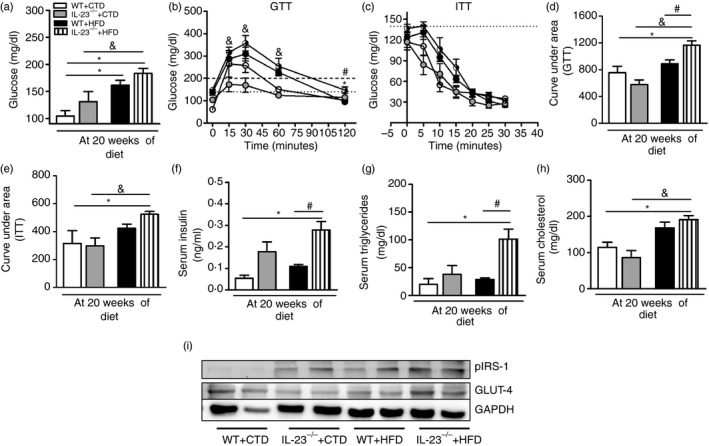
Figure 3.

Metabolic parameters and total glucose transporter type 4 (GLUT‐4) and phosphorylated insulin receptor substrate 1 (IRS‐1) expression in the muscle of wild‐type (WT) and interleukin‐23 p19‐deficient (IL‐23p19–/– mice fed a control diet (CTD) or high‐fat diet (HFD) for 20 weeks. Fasting blood glucose levels (a) and glucose levels after glucose tolerance test (GTT) (b) or insulin tolerance test (ITT) (c). Area under the curve for the GTT (d) or ITT (e) were also calculated. Concentrations of insulin (f), triglycerides (g) and cholesterol (h) were determined in the serum. Total GLUT4 and Ser1101 phosphorylated IRS‐1 expression in skeletal muscle was determined by Western blot (i). Asterisks represent statistically significant differences (*P < 0·05) compared with WT on CTD; (# P < 0·05) compared with WT on HFD; (& P < 0·05) compared with IL‐23p19–/– mice on CTD. Significant differences between the groups were compared by one‐way analysis of variance followed by Tukey's multiple‐comparison test. The results are representative of a single experiment repeated three times.
