Fig. 1.
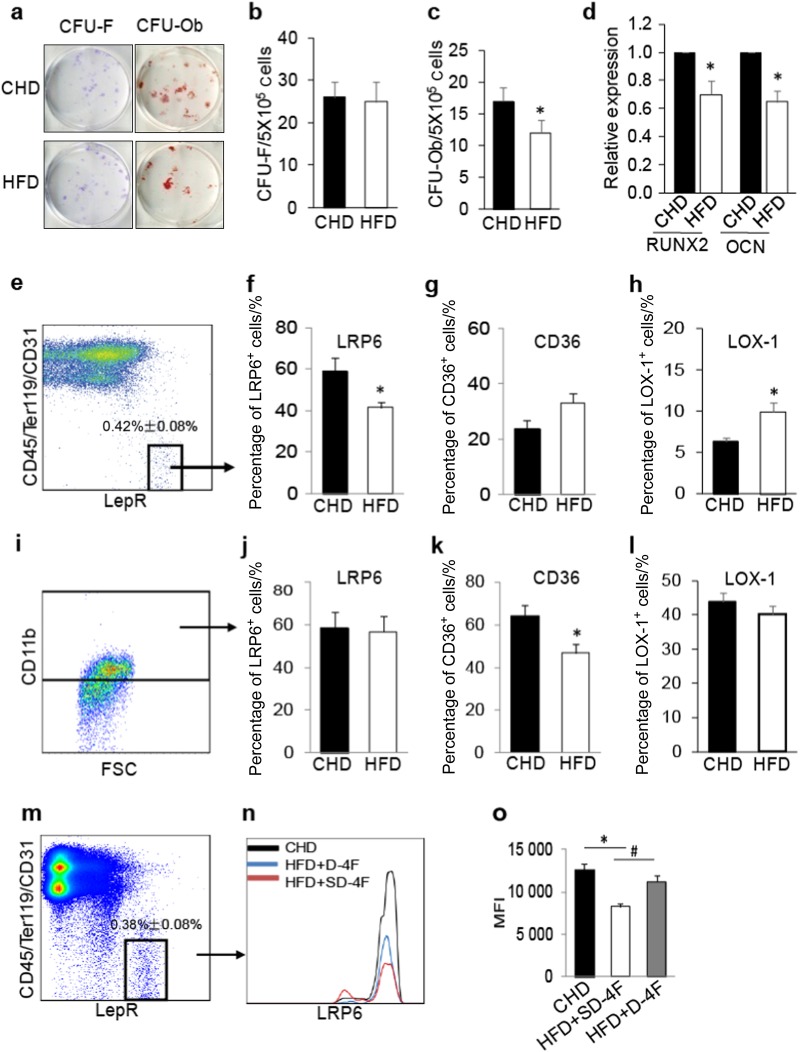
Cell Surface LRP6 Is Reduced in Bone Marrow MSCs under Microenvironment of High oxPLs. a–c Representative images (a) and the quantified CFU-F frequency (b), and CFU-Ob frequency (c) of bone marrow MSCs from 10-week-old C57BL/6 mice fed Western high fat diets (HFD) or standard chow diets (CHD) for 4 weeks. d Bone marrow MSCs from 10-week-old C57BL/6 mice fed HFD or CHD for 4 weeks were incubated with osteogenic medium for 7 days. mRNA expressions of RUNX2 and osteocalcin (OCN) were detected by Real-time PCR analysis. n = 5 mice per treatment group from six independent experiments, data are represented as mean ± s.e.m. *p < 0.05, vs. CHD group, as determined by Student’s t-tests. e–h Representative images of the flow cytometry analysis (e) and the percentage of LRP6+ (f), CD36+ cells (g), and LOX-1 (h) in LepR+CD45–CD31–Ter119- cell population from 10-week-old C57BL/6 mice fed Western high fat diets (HFD) or standard chow diets (CHD) for 2 weeks. n = 5, data are represented as mean ± s.e.m. *p < 0.01 vs. CHD group, as determined by Student’s t-tests. i–l Representative images of the flow cytometry analysis (i) and the percentage of LRP6+ (j), CD36+ cells (k), and LOX-1 (l) in CD11b+ cell population from 10-week-old C57BL/6 mice fed Western high fat diets (HFD) or standard chow diets (CHD) for 2 weeks. n = 5, data are represented as mean ± s.e.m. *p < 0.01 vs. CHD group, as determined by Student’s t-tests. m–o 10-week-old C57BL/6 mice fed CHD or HFD together with D-4F peptide (HFD + D-4F) or scrambled D-4F peptide (HFD + SD-4F) for 2 weeks. The peptides were administered orally in drinking water at 0.4 mg·mL-1, equivalent to 1.6 mg/d. Flow cytometry analysis of LRP6+ cells in bone marrow LepR+CD45–CD31–Ter119- MSCs (i). Representative histograms showing relative intensity of LRP6 antibody-conjugated fluorescence in the three groups (j). Quantitative analysis of the relative fluorescence intensity in the three groups (k). n = 5, data are represented as mean ± s.e.m. *p < 0.01 vs. CHD group, #p < 0.01, vs. HFD + SD-4F group, as determined by Student’s t-tests

