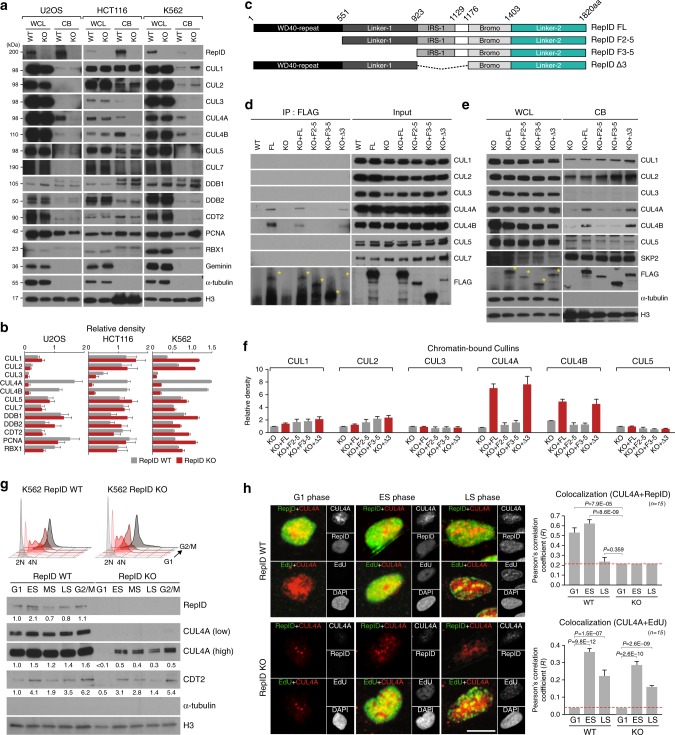
Fig. 1.
RepID is required for CUL4 loading on chromatin. a Levels of RepID, cullins and their complexes from wild-type (WT) or RepID-depleted (KO) U2OS, HCT116 and K562 cancer cell lines. Histone H3 and α-tubulin were used as loading controls. WCL, whole cell lysates; CB, chromatin-bound proteins. b Quantification of relative intensities of chromatin-bound protein signals analyzed as shown in a after normalization with respect to histone H3 signal intensities in each cell line. CUL4 was indicated as bold. Error bars represent standard deviations from three independent experiments. c Construction of RepID fragments. d Soluble nuclear and chromatin-bound fractions were extracted from U2OS cells transfected with RepID fragments as indicated. A pull-down assay using a FLAG antibody was performed and co-precipitated cullins were analyzed by immunoblotting. Yellow asterisks, FLAG-RepID fragments. e Cullin levels in WCL and CB from RepID KO U2OS cells transfected with RepID constructs as indicated. f Quantification of chromatin-bound cullin levels, normalized to chromatin bound levels in RepID KO cells. Error bars represent standard deviations from three independent experiments. g K562 RepID WT and KO cells were fractionated by elutriation and cell cycle status of each fraction (G1, early [ES], middle [MS], and late [LS] S-phase and G2/M) was confirmed by FACS (upper panel). Chromatin-bound proteins were analyzed by immunoblotting (bottom panel). The numbers under the panels represent the intensity ratios for each protein normalized by the intensity of the signal at G1 phase in RepID WT from three independent experiments (bold). h U2OS cells were EdU-labeled, pre-extracted and chromatin-bound RepID (green), chromatin-bound CUL4A (red), DNA content (DAPI) and EdU (magenta) were detected. Cells in ES and LS were identified by EdU staining patterns and G1 and G2 nuclei (EdU negative) were identified by DAPI intensity. To clearly observe colocalization with EdU and CUL4A, magenta was converted to green (left panel). The extent of colocalization between RepID and CUL4A, or between EdU and CUL4A (right panel). Pearson’s correlation coefficients (n = 15) and p-values were calculated using a two-tailed t-test. RepID KO cells were used to estimate background (red line, right panel). Scale bar indicates 10 μm

