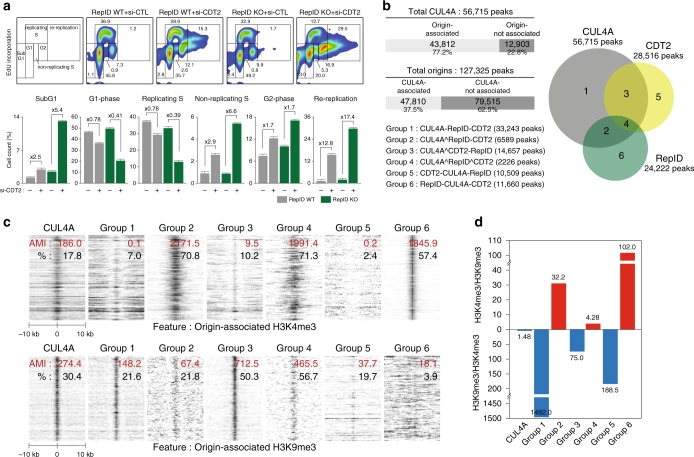
Fig. 3.
CUL4A colocalizes with distinct replication origins and different DCAFs during S phase. a CDT2-siRNA transfected RepID WT and KO U2OS cells were labeled with EdU for 30 min and analyzed by flow cytometry. Percentages of cells in each cell cycle phase are indicated in the flow cytometry plots (upper panel) and histograms (bottom panel). Fold changes were based on the values from control-siRNA transfected cells. Data are representatives of three independent experiments. b Left, table indicating colocalizations between CUL4A ChIP-Seq and replication origins (^: intersection, -: subtraction). Right, Venn diagram comparing CUL4A, CDT2 and RepID ChIP-Seq results. Three subgroups indicate CUL4A binding sites overlapping with RepID (Group 2), CDT2 (group 3), RepID and CDT2 (group 4) while three subgroups represent exclusive binding sites for CUL4A (group 1), CDT2 (group 5) and RepID (group 6). c Heat maps showing colocalization between the six subgroups defined in b and sites enriched in methylated histone H3 (H3K4me3, top panel and H3K9me3, bottom panel). AMI value (red) and colocalized percentage (black) are indicated. Twenty kb windows were used for the analysis. d A centered bar chart representing the AMI ratio from c between H3K4me3 and H3K9me3

