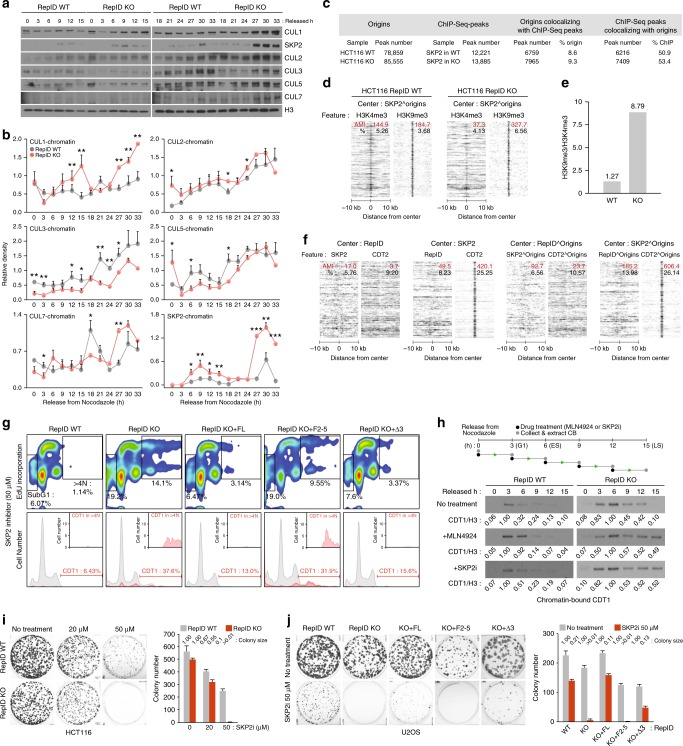
Fig. 5.
SKP2 inhibitors synergize with RepID depletion to kill cancer cells. a HCT116 cells released from nocodazole were collected every 3 h for up to 33 h, and chromatin-bound cullins were analyzed using immunoblotting. b Graphs showing relative intensities of cullins and SKP2 calculated from blots derived from (a) and normalized using histone H3 levels. Error bars represent standard deviation from three independent experiments (*p-value < 0.05, **p < 0.01, ***p < 0.001, no asterisk: n.s.). c Table depicting the colocalization between SKP2 ChIP-seq peaks and replication origins in HCT116 WT or RepID KO cells. d Heat map showing the colocalizations between origin-associated SKP2 and the H3K4me3 or H3K9me3 peaks (AMI, red; colocalized percentage, black; ^, intersection). e Bar graph representing the AMI ratios from d. f Heat maps for colocalizations between RepID and SKP2 or CDT2 peaks (first panel), between SKP2 and RepID or CDT2 peaks (second panel), between the origin-associated RepID and the origin-associated SKP2 or origin-associated CDT2 (third panel), and between the origin-associated SKP2 and origin-associated RepID or origin-associated CDT2 (fourth panel). window scale, 20 kb. g WT, RepID KO U2OS cells and RepID KO U2OS cells transfected with the specified RepID fragments were treated with 50 μM SKP2 inhibitor for 2 days and labeled with EdU. Cell cycle (upper panel) and chromatin-bound CDT1 (bottom panel) were analyzed as in Fig. 4d. h Top, a schematic of the experimental procedure. Mitotic HCT116 WT or RepID KO cells were released in fresh medium and collected every 3 h with MLN4924 or SKP2 inhibitors added during the last 3 h prior to collection. The time zero samples were mitotic cells without drug exposure. Chromatin-bound CDT1 was analyzed and normalized using histone H3. Fold changes were calculated using the highest CDT1 intensity (bold) in each group from three independent experiments. i, j Colony assay with HCT116 cells (i) and U2OS cells (j). bar charts, colony number. Ratios for the average size of colonies in each group relative to the size of colonies in untreated cells are provided above the bars. Error bars represent standard deviations from three independent experiments

