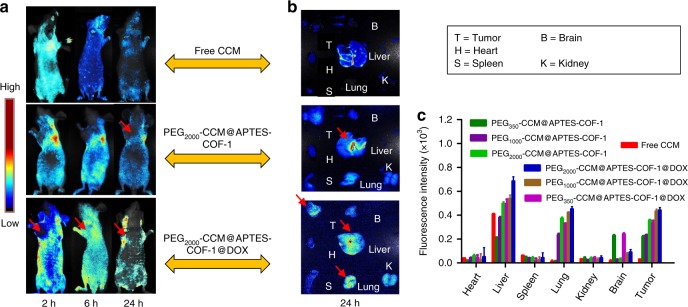
Fig. 7.
Fluorescence imaging and fluorescence intensity characterizations. a Ex vivo fluorescence images (ex: 455 nm) and b in vitro fluorescence images of major organs and tumors of mice after intravenous injection of PEG2000-CCM@APTES-COF-1, PEG2000-CCM@APTES-COF-1@DOX over a period of 24 h. c Mean CCM fluorescence intensities of major organs and tumor at 24 h after administration. Tail injection into the HeLa tumor-bearing mice was at a single sample dose of 5 mg kg−1 in PBS (3 mice/group). Each data point represents the average and SD (one above and one below for the error bars) as measured from five different analysis in a single experiment

