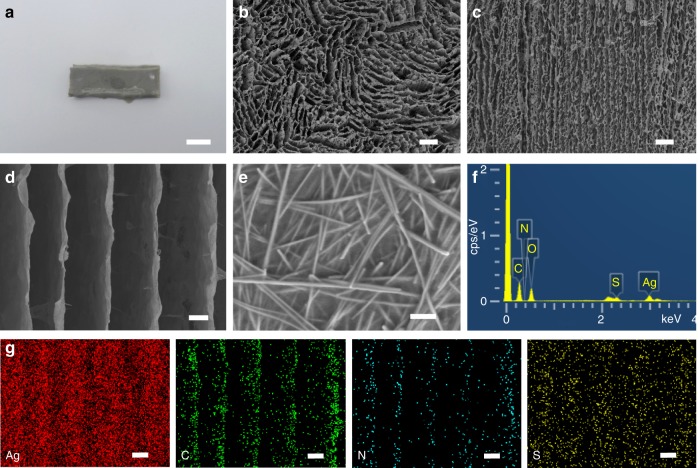
Fig. 2.
Structural and compositional characterizations. a Photograph of a piece of AATN hydrogel. Scale bar, 5 mm. b Top-view SEM image of AATN hydrogel. Scale bar, 100 μm. c, d Different magnifications of side-view SEM images of AATN hydrogel. Scale bars, 100 μm in c and 20 μm in d. e Further magnified SEM image of the lamella in AATN hydrogel. Scale bar, 500 nm. f EDS spectrum of AATN hydrogel. g Elemental mappings of Ag, C, N, and S elements in AATN hydrogel in d. Scale bars, 20 μm

