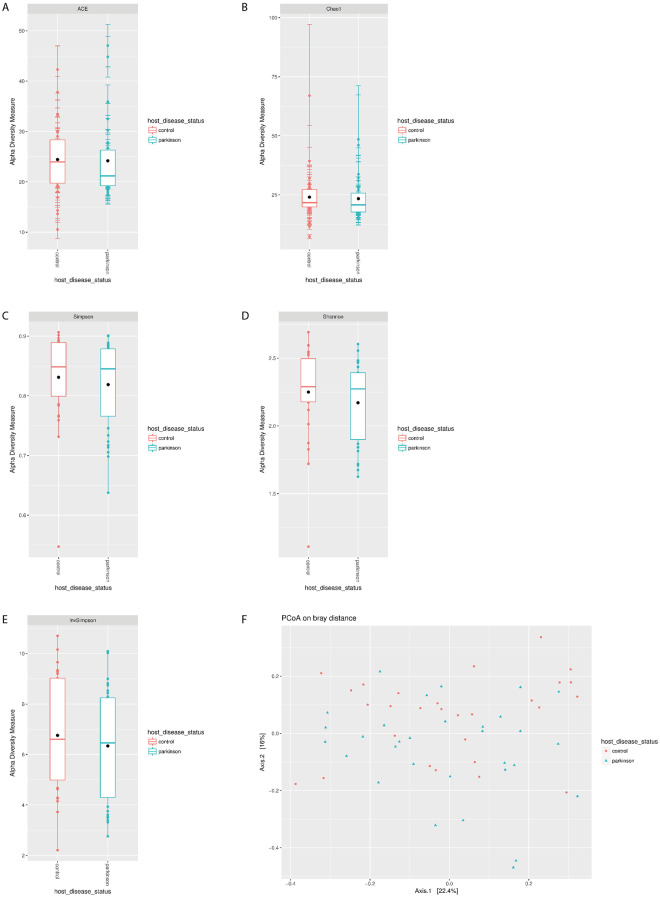
Figure 1.
Decreased bacterial richness in the microbiome of PD patients. (A) ACE, (B) Chao1 and α-diversity, (C) Shannon, (D) Simpson, and (E) inverse Simpson indexes; *p < 0.05 compared to control, (F) PCoA plots of β-diversity in PD and control samples based on Bray-Curtis dissimilarity analyses of relative OTU composition in the samples. Each dot represents a scaled measure of the composition of a given sample, colour- and shape-coded according to the group.

