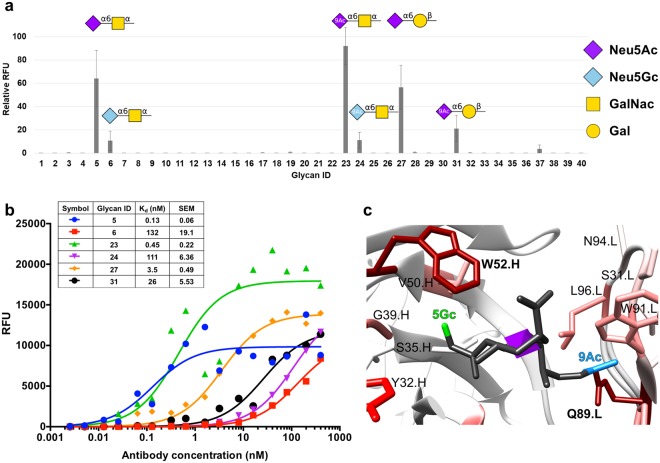
Figure 3.
TKH2 glycan microarray analysis of specificity and affinity. (a) Binding of mTKH2 to diverse glycans was examined at 30, 12, 6 and 2.4 ng/µl by a sialoglycan microarray printed at four replicate spots per glycan. Relative fluorescence units (RFU) was calculated as percentage of maximal binding at each concentration, followed by averaging the relative RFU rank of the four tested antibody concentrations for each glycan (mean ± SEM; 9Ac denotes 9-O-acetylation on the sialic acids). Representative of two independent experiments (full data in supplementary Excel file). (b) Binding of the chimeric hTKH2 was tested at 16 serial dilutions (400–0.00256 nM) for the top six bound glycans (full data in supplementary Excel file). Apparent KD was calculated according to non-linear fit with one-site specific binding using GraphPad Prism 6.0. (c) Modeling of the STn ligand within the antibody binding site. The N-glycolyl (5Gc; green) and 9-O-acetylation (9Ac; cyan) sialic acid derivatives were built onto the final 3D structure model of TKH2 (grey). Proximal amino acids in the antibody binding site are colored.

