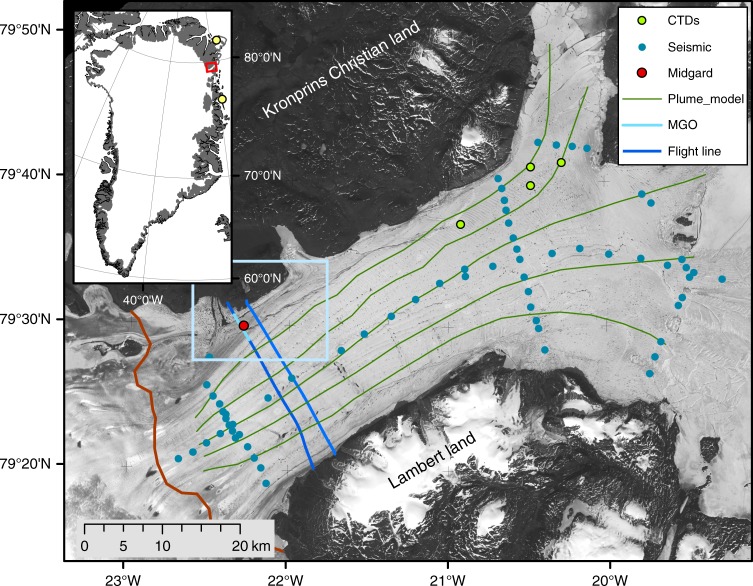
Fig. 1.
The floating part of 79 North Glacier with the data sets used in the study. 79 North Glacier in Northeast Greenland, with the locations of the cross profiles used in this analysis (dark blue: Radar and IceBridge flight lines, light blue: MGO cross profile as in Figs. 2,4 and 6). The location of the Midgardsormen experiment is shown as a red dot, while the seismic measurements from 1997 and 1998 are shown as blue dots13. The light green dots represent the CTD profiles used in this study. The green lines represent transects used for the plume model simulations. The light blue box shows the geographical extent of Fig. 4 and the upstream part of the MGO-ridge (gray winding feature). The grounding line is indicated by the red line in the lower left corner. The ice shelf front is located to the right of the image and towards the North (Djimphna Sund, at the upper right part of the image). The background image is taken from a Landsat 5 scene from 25 July 1998. The locations of the weather stations in Danmarkshavn and Station Nord are shown in the inset map as yellow dots

