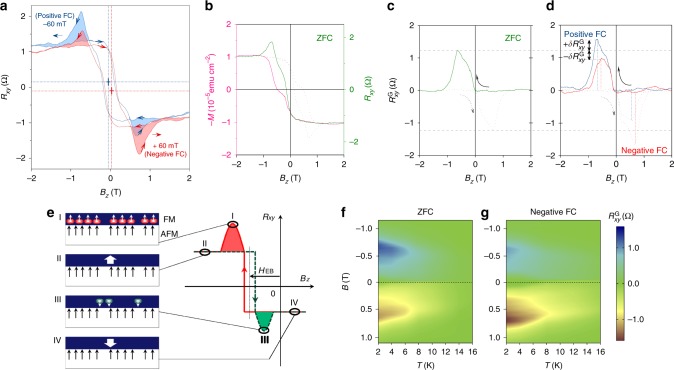
Fig. 2.
Exchange-biased geometric Hall effect (GHE). Shown are the data from the TI/antiferromagnet bilayer at 1.9 K. a Hall resistance obtained in an applied perpendicular field. The dashed lines indicate the lateral shifts of . The colored areas show the magnitude change of the peak and dip regions referring to the GHE. This magnitude change along with the lateral shift is the signature of the exchange-biased GHE. b Plots of field-dependent magnetization and . The – loop (pink) is obtained using a superconducting quantum interference device. The geometric Hall component, , is obtained by subtracting the normalized magnetization (pink) from the (green). c obtained after ZFC, whose magnitudes are compared with those obtained after positive/negative FCs processes as shown in (d), where marks the differences. This magnitude change demonstrates the signature of the exchange bias experienced by the topological charges. The gray dashed lines are guides to the eyes. e A schematic demonstration of the exchange-biased topological charges. The anchoring spins in the AFM layer assist the nucleation of positive topological charges (red circles) while prohibit the negative ones (green circles). f Phase diagram of the GHE as functions of both the temperature and the magnetic field after ZFC. The blue and red areas show the without the exchange bias, which is symmetric with respect to the line. g The red component grows while the blue one shrinks after a negative FC process. Such an asymmetric phase diagram contrasts with the symmetric one obtained after a ZFC process, demonstrating the exchange bias experienced by the topological charges

