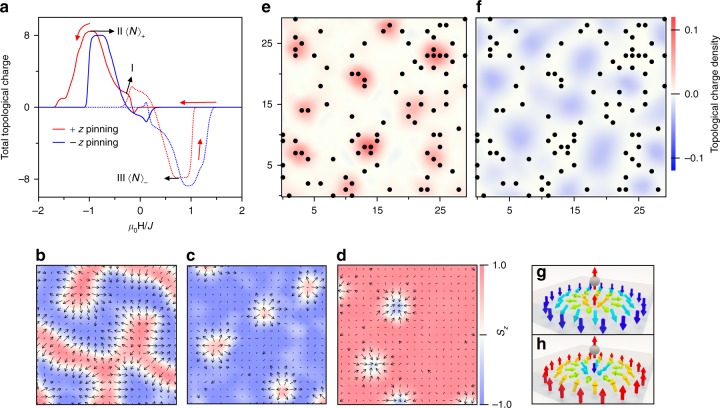
Fig. 3.
Stochastic micromagnetic simulation of the topological exchange bias. This simulation was calculated using a toy model on a 30 × 30 grid with a periodic boundary condition. The topological charges in this model are assumed to be carried by magnetic skyrmions. a The calculated total topological charge averaged during 300 cycles of the sweep of the applied field. The solid lines denote the positive-to-negative field scan, whereas the dotted lines denote the inverse ones. b–d Three snapshots of the simulation at different states of the switching: b is for a helical phase of stripe domains; c is for positive topological charges, and d is for negative ones. Averaged topological charge density for e positive and f negative topological charges. The anchoring spins are denoted by the circular solid points, with their spins polarized out of plane. The color map of the average local topological charge denotes the possibility of the topological-charge nucleation, red for positive charges and blue for negative ones. Opposite anchoring spins give rise to a similar picture but with the opposite sign. g, h Two different spin configurations with the topological charges changing polarities with respect to the frozen anchoring spins in the AFM layer. g Positive topological charges are formed with their central spins parallel with the anchoring spins, whereas (h) shows the case of an opposite alignment

