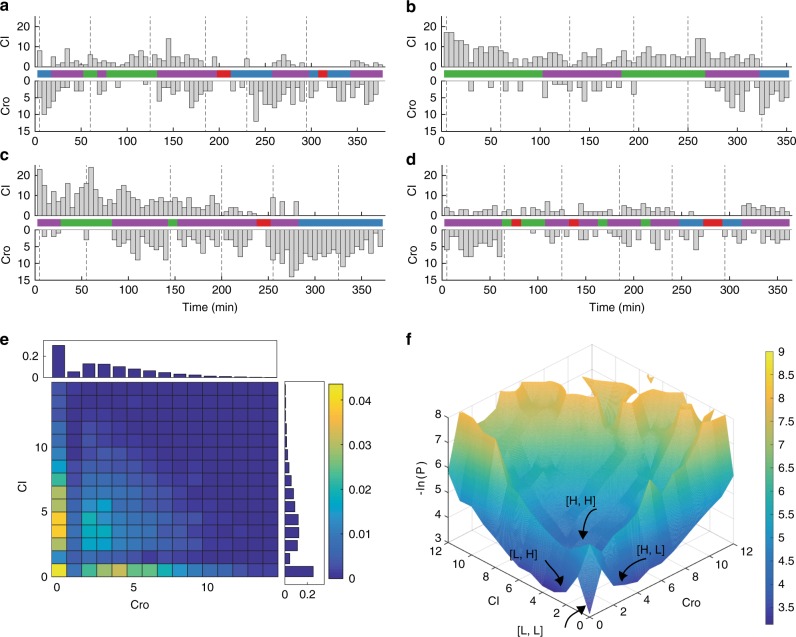
Fig. 3.
Real-time production time traces of CI and Cro in strain XF224 showed four distinct populations at 36.5 °C. a–d Time traces of newly produced CI (top) and Cro (bottom) molecule numbers in the same cells in four representative XF224 cell lineages. The corresponding state-switching time trace identified by HMM is shown in the middle panel of each lineage, with blue corresponding to state [H, L] for high Cro and low CI production, green to [L, H], purple for [H, H] and red for [L, L]. The dashed vertical lines indicate cell division. e 2D histogram of produced CI and Cro protein molecules in individual cells measured at each 5-min frame in time-lapse experiments (n = 6453 frames from 94 time traces). Corresponding 1D histograms of CI and Cro are shown on the right and top of the 2D histograms, respectively. Colors and scale bars indicate fractions of cells. f The potential landscape was calculated using the experimentally measured 2D histogram of CI and Cro expression numbers in every 5-min frame and interpolated

