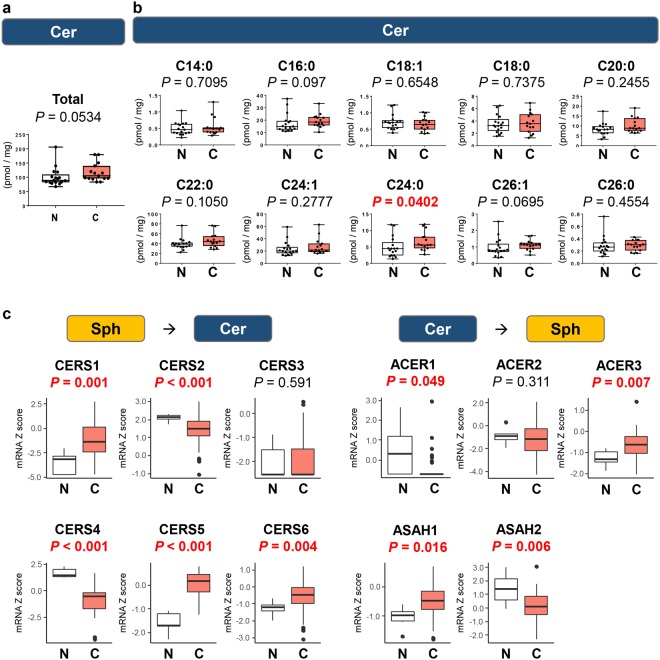
Figure 2.
Ceramide is not increased in biliary tract cancer compared to normal biliary tract tissue. The levels of total ceramide (a) and each ceramide species (C14:0, C16:0, C18:1, C18:0, C20:0, C22:0, C24:1, C24:0, C26:1, and C26:0) (b) in biliary tract cancer (n = 15) and normal biliary tract tissue (n = 17) were determined by LC-ESI-MS/MS. (c) The gene expression levels of CERS1, CERS2, CERS3, CERS4, CERS5, CERS6, ACER1, ACER2, ACER3, ASAH1 and ASAH2 in TCGA cohort (36 and 9 samples of cancer and non-cancer tissue in cholangiocarcinoma cohort) were analyzed. Mean values are shown by the horizontal lines. Two-sided P values < 0.05 were considered statistically significant (Mann-Whitney U test). N: normal biliary tract tissue; C: biliary tract cancer tissue.

