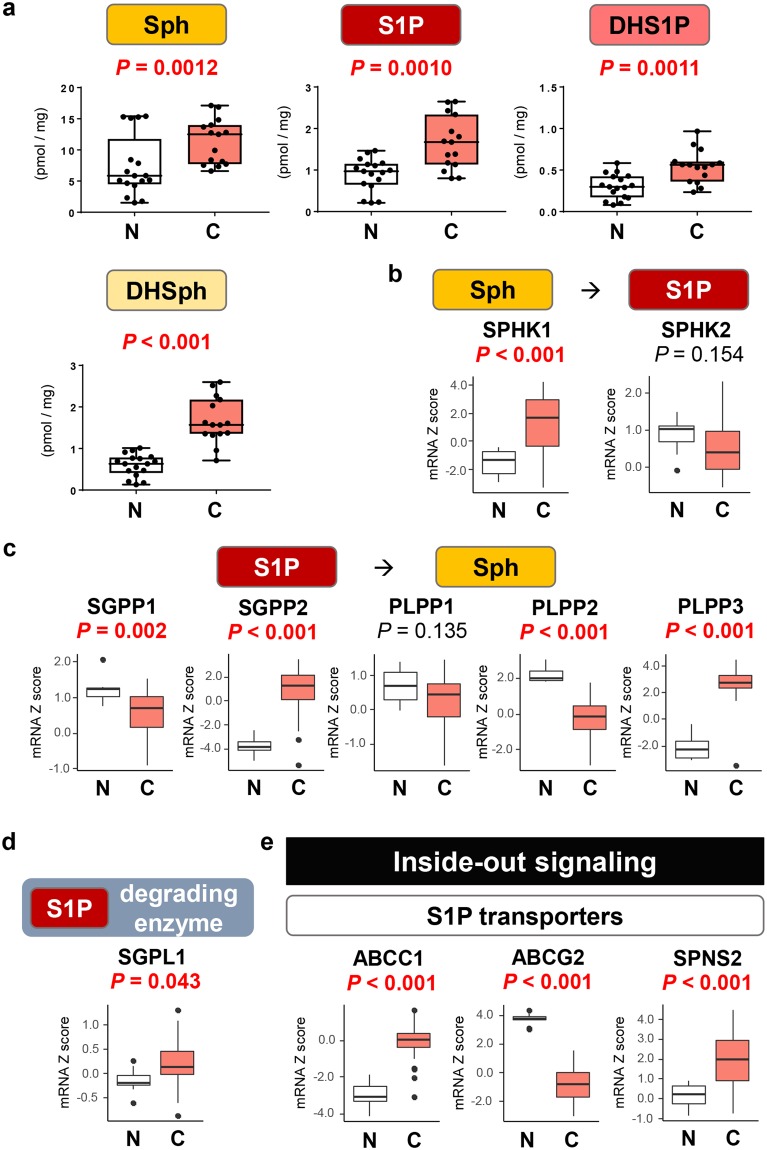
Figure 3.
The levels of S1P and SPHK1 are increased in biliary tract cancer compared with normal biliary tract tissue. (a) The levels of the S1P, DHS1P, Sph and DHSph were determined by LC-ESI-MS/MS. (b) The gene expression levels of SPHK1 and SPHK2 in TCGA cohort (36 and 9 samples of cancer and non-cancer tissue in cholangiocarcinoma cohort) were analyzed. (c) The gene expression levels of SGPP1, SGPP2, PLPP1, PLPP2 and PLPP3 in the TCGA cohort were analyzed. (d) The gene expression level of SGPL1 in the TCGA cohort was analyzed. (e) The gene expression levels of ABCC1, ABCG2 and SPNS2 in the TCGA cohort were analyzed. Mean values are shown by the horizontal lines. Two-sided P values < 0.05 were considered statistically significant (Mann-Whitney U test). N: normal biliary tract tissue; C: biliary tract cancer tissue.

