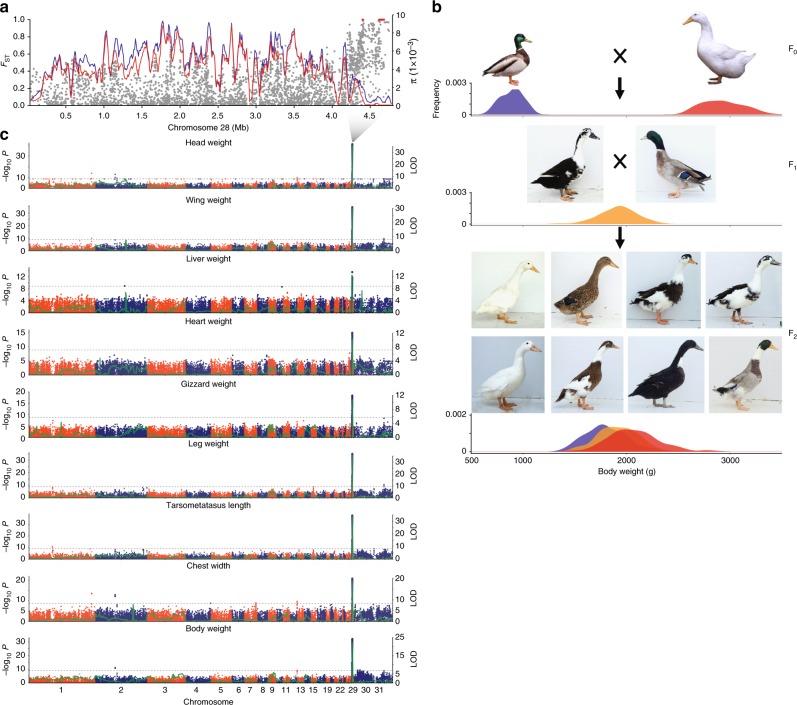
Fig. 3.
Selective sweep associated with body size. a Fixation index (FST, gray dots) for all SNPs between mallards and Pekin ducks and nucleotide diversity (π) in 40-kb sliding windows with 10-kb steps in mallards (blue line) and Pekin ducks (red line) along chromosome 28. Red dots indicate fixed SNPs. b Diagram of the F2 population and its body weight and plumage color segregation. The distribution of body weight is presented under the duck images. Blue, red, and orange refer to the mallard, Pekin duck, and heterozygotic haplotypes of IGF2BP1, respectively. c GWAS and linkage analyses of traits related to duck body size. The green lines refer to the logarithm of the odd (LOD) values. The gray horizontal dashed lines indicate the Bonferroni significance threshold of the GWAS (1 × 10⁻⁹)

