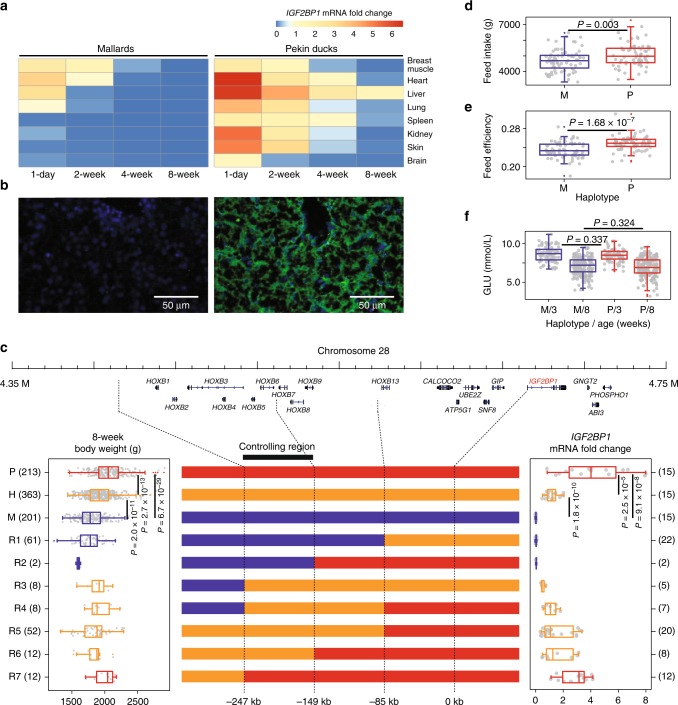
Fig. 4.
Genetic basis of IGF2BP1 for the enlarged body size of duck. a Spatial and temporal expression of IGF2BP1 in mallards and Pekin ducks measured by qPCR. b Immunofluorescence histochemistry staining for IGF2BP1 (green) in liver tissue of mallards and Pekin ducks at 1 day of age. Nuclei were stained with DAPI. c Fine mapping of the regulatory region of IGF2BP1. Blue, red, and orange bars (center panel) refer to mallard (M), Pekin (P), and heterozygotic (H) genotypes, respectively. R1-7 refer to seven recombinant types. The left and right box plots refer to body weight and IGF2BP1 expression levels, respectively. The numbers of individuals are given in brackets. The d feed intake, e feed efficiency, and f 3-week and 8-week serum glucose levels were measured in F2 individuals with the mallard (M) and Pekin duck (P) genotypes. The indicated P values are based on one-way ANOVA. Box plots denote median (center line), 25–75th percentile (limits), minimum and maximum values without outliers (whiskers), and outliers (red and blue dots)

