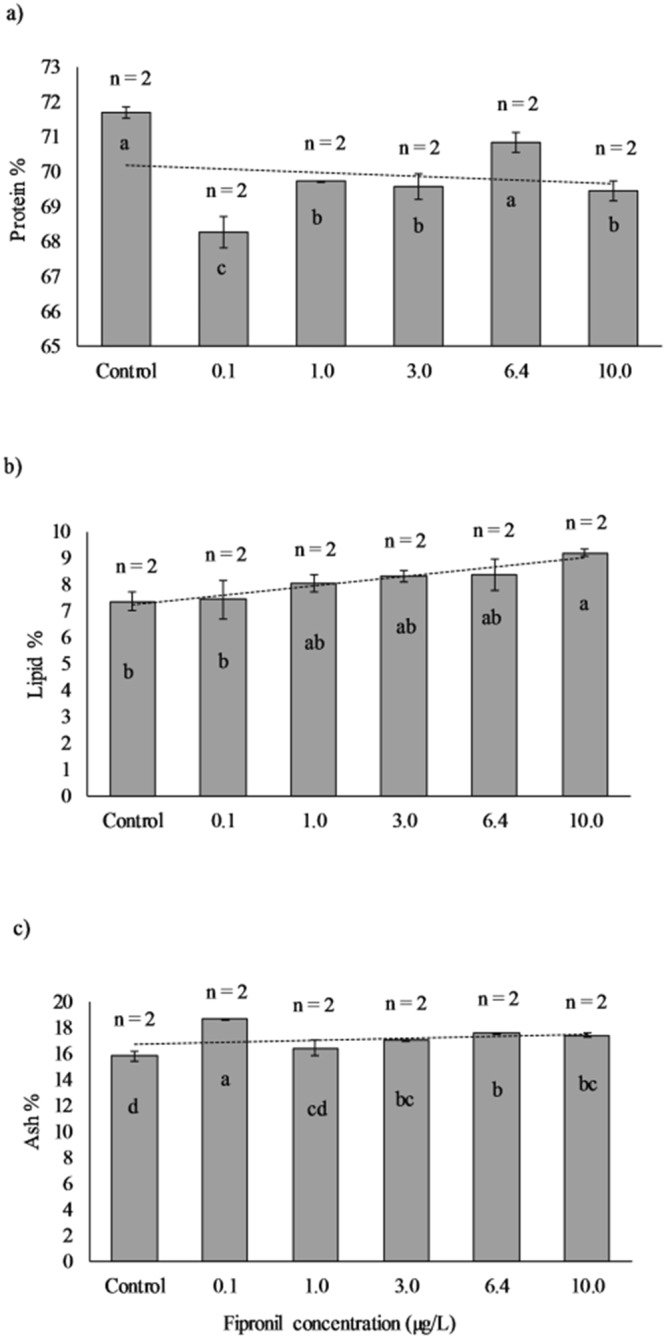
Figure 5.

Analysis of body composition of juvenile shrimp under different fipronil concentrations. The horizontal axes in (6.a, 6.b, and 6.c) represent the six fipronil concentrations (µg/L) used during the experiment while the vertical axes represent the protein % (in 6.a), lipid % (in 6.b), and ash % (in 6.c) in bodies of juvenile shrimp measured at the end of the experiment. Dashed lines are fitted regression lines. Error bars indicate the standard errors (n = number of samples analyzed from each treatment). One-way Analysis of Variance (P < 0.05) showed that means in columns not sharing the same letter are significantly different.
