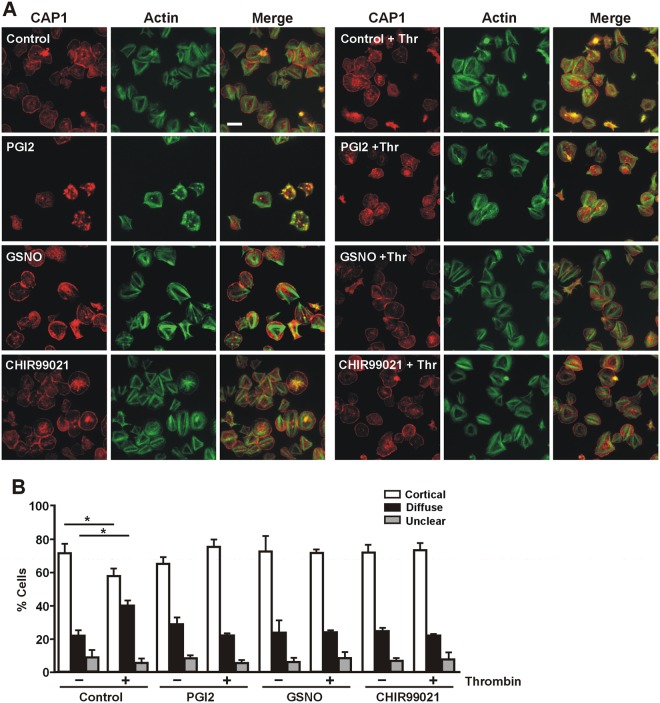
Figure 5.
Effects of PGI2, GSNO and GSK3 inhibition on CAP1 relocalisation upon thrombin stimulation. Platelets were allowed to spread on fibrinogen-coated coverslips and then treated with 100 nM PGI2 for 5 minutes, 10 µM GSNO for 20 minutes or 2 µM CHIR99021 for 10 minutes prior to stimulation with 0.1 U/mL thrombin for 30 seconds. Platelets were fixed with paraformaldehyde and immunostained with an anti-CAP1 antibody followed by an Alexa568-coupled secondary antibody (red) and counterstained with FITC-phalloidin for filamentous actin (green). Images were acquired with a fluorescence microscope equipped with a structured illumination attachment. Scale bar 5 µm. (B) Quantification of the pattern of CAP1 distribution before (−) and after (+) thrombin stimulation. The proportions of cells with predominantly cortical or diffuse distribution of CAP1 in images like the ones shown in A were calculated from 2 to 5 independent experiments each performed in duplicate coverslips. At least 1000 cells per condition in each experiment were scored. Unclear refers to cells that were not sufficiently enough spread to make a judgment. Data are average ± SEM. *p ≤ 0.05 relative to the respective population not stimulated with thrombin, Mann Whitney test.

