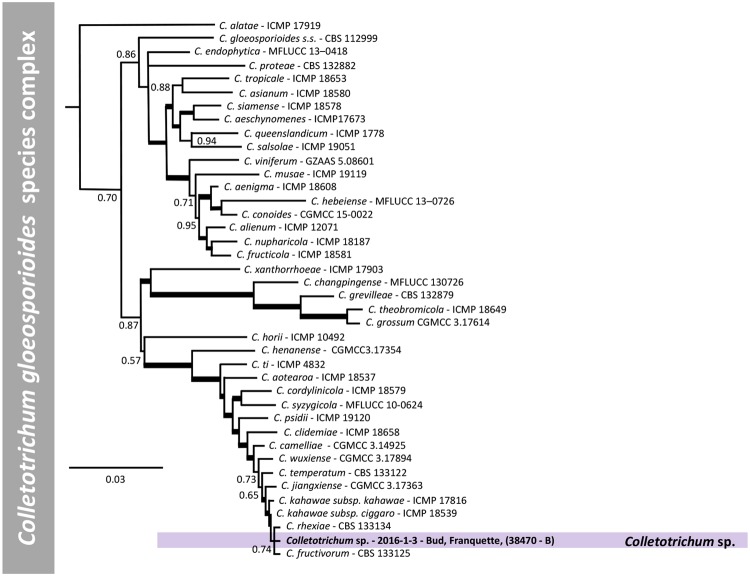
Figure 7.
Bayesian inference phylogenetic tree reconstructed from a combined ITS, GAPDH, CHS-1, ACT, TUB2, GS, SOD2, ApMAT and CAL sequence alignment of 40 isolates of the C. gloeosporioides species complex including the outgroup. Bayesian posterior probability (BPP) values (above 0.50) are shown at the nodes. The thickened nodes represent BPP of 1. Isolates obtained in this study are emphasized in bold font. Colletotrichum sydowii CBS 135819 is used as outgroup. The scale bar represents the number of expected substitutions per site. Information such as tissue sampled, cultivar and geographic information (in brackets) for the isolates obtained in this work are reported.

